How to Speed up Your Website with Netpeak Spider
Use Cases

There is no chance to occupy SERP's top if your website is slow. As the saying runs, time is money and user's time is potentially your money, so don't waste it on waiting.
In this post, you'll find out the difference between website loading speed and server response speed, why your website is loading slowly and how to speed it up ;)
Read more → Website speed test
1. What is Website Load Speed?
Website load speed indicates how long all content is downloading on a specific page of your website. Sometimes it is confused with the 'page speed'. This measurement includes those processes that the user's browser executes while downloading the page content transmitted by the server.
It's not a secret, that if your site is loading too long, the potential client will most likely go to a faster site of your competitor. Losing a user, you lose a possible conversion. Keep in mind that during the first load of the site the cache of the page is being formed, and all the next visits will have a higher download speed.
1.1. Load Speed vs. Server Response Time
The concept of 'site load speed' is often confused with 'server response time', and, therefore, it is necessary to understand the difference between these two indicators.
The server response time (also the 'time to first byte') is time between the request from the client and the server's response to this request. The shorter server response time, the faster page loads.
The server response time in Netpeak Spider is based on the search engines recommendations:
- Fast (< 500 ms)
- Average (500 ms < 1 s)
- Slow (1 s < 2 s)
- Very slow (> 2 sec)
In the crawler settings, you can set the indicators you need.
In other words, the server response time is the time the server takes to respond to the browser, and the site load speed is the speed at which the browser will fully load your site.
1.2. Load Speed as a Ranking Factor
Google determined website speed as a ranking factor in 2010. However, keep in mind that the search engine takes into account many other factors, and the load speed is not the key one.
Moz.org published a study which reveals that the site load speed doesn't affect the ranking. But the server response time does.
Since the site load speed depends not only on time to first byte, it would be better to understand what else affects this indicator and why it is worth improving it. So let's dig further!
2. How to Check Load Speed and Server Response Time with Netpeak Spider
-
Start crawling.

-
When crawling is finished, you will find the 'Response Time' panel with a review of the crawling results on the Dashboard.
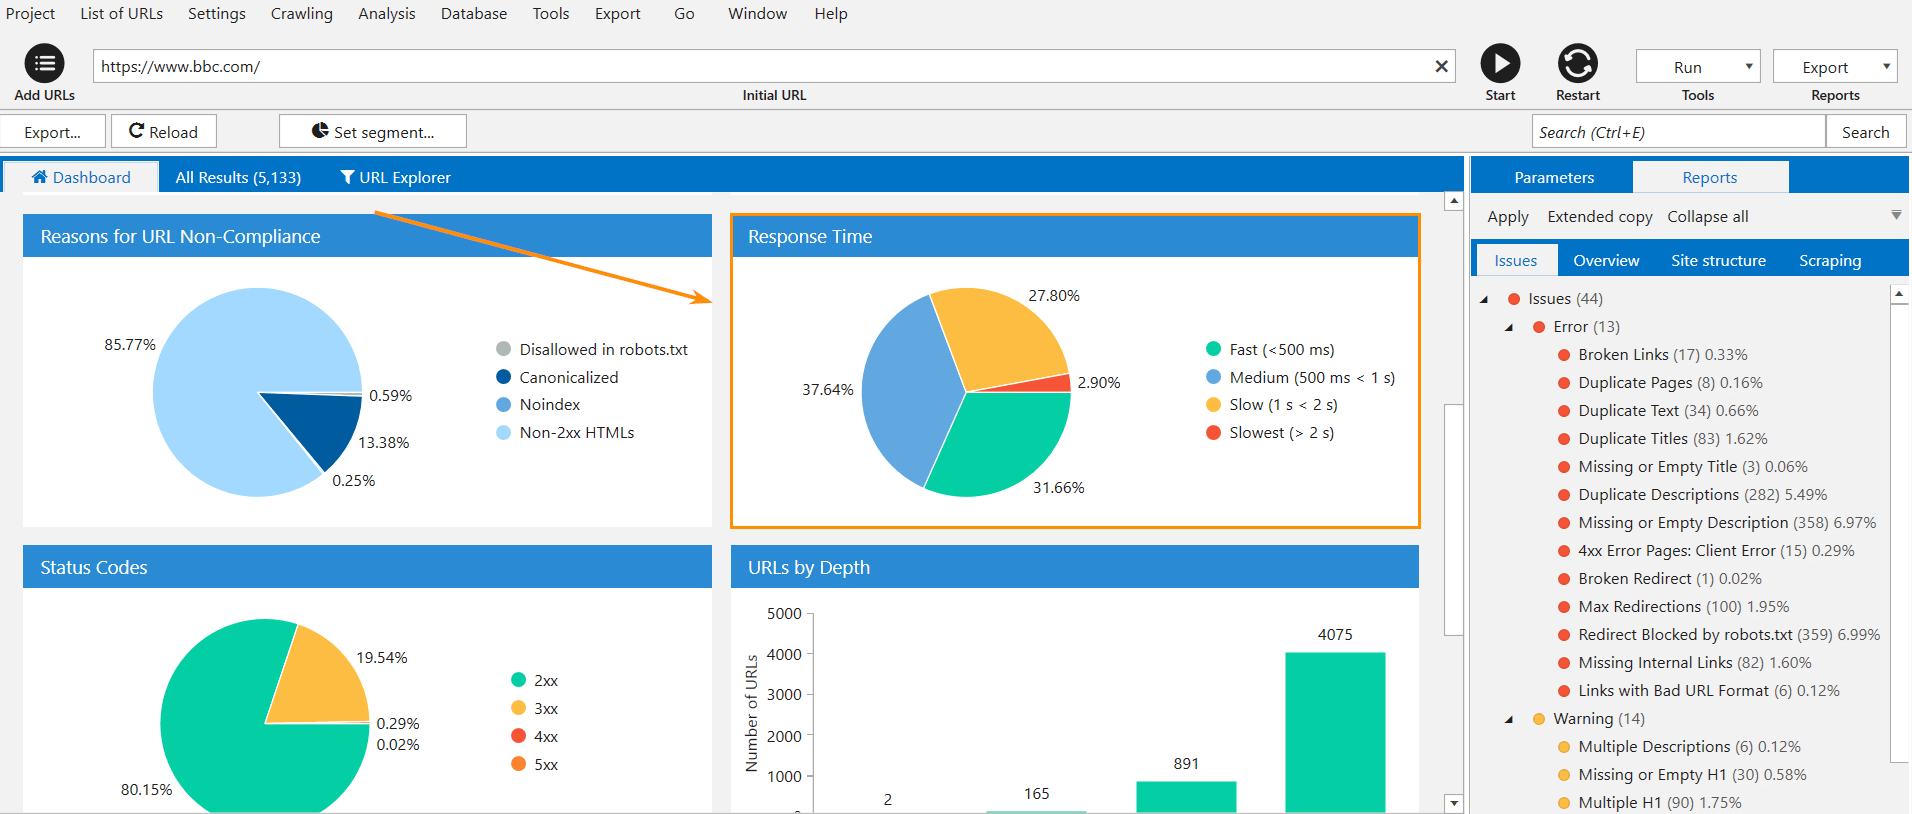
- Click on the red color in the diagram to see which URLs are loading slowly and find out the detailed information about them.
-
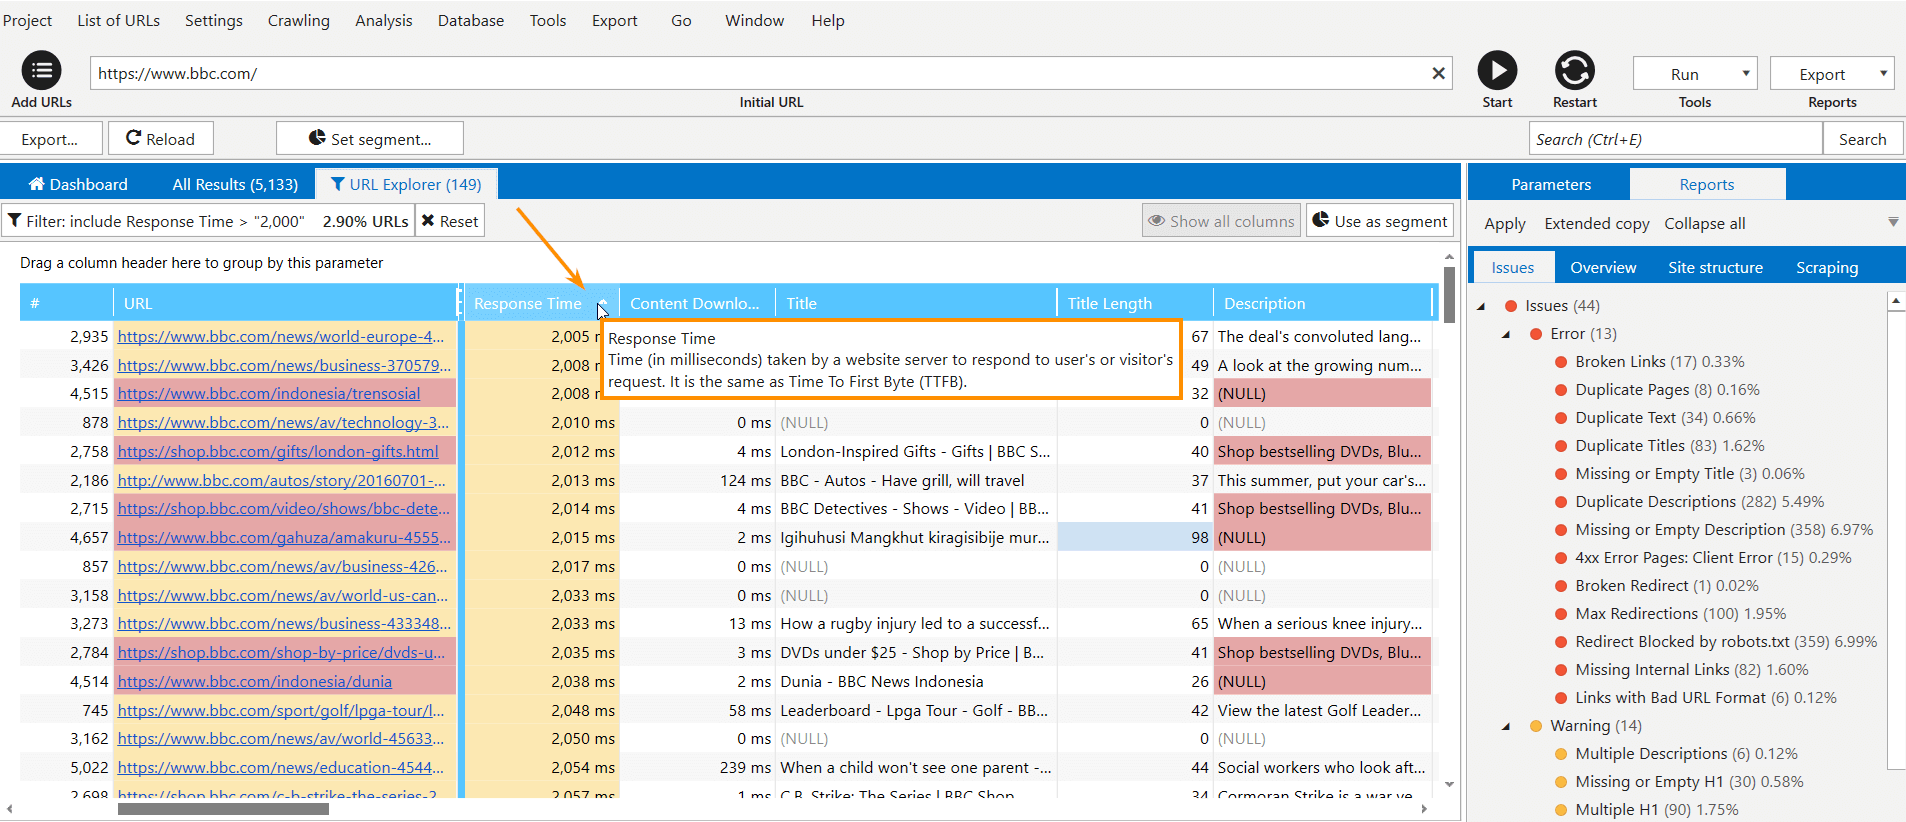
The 'Response Time' column displays the corresponding value for each URL on your site.
-
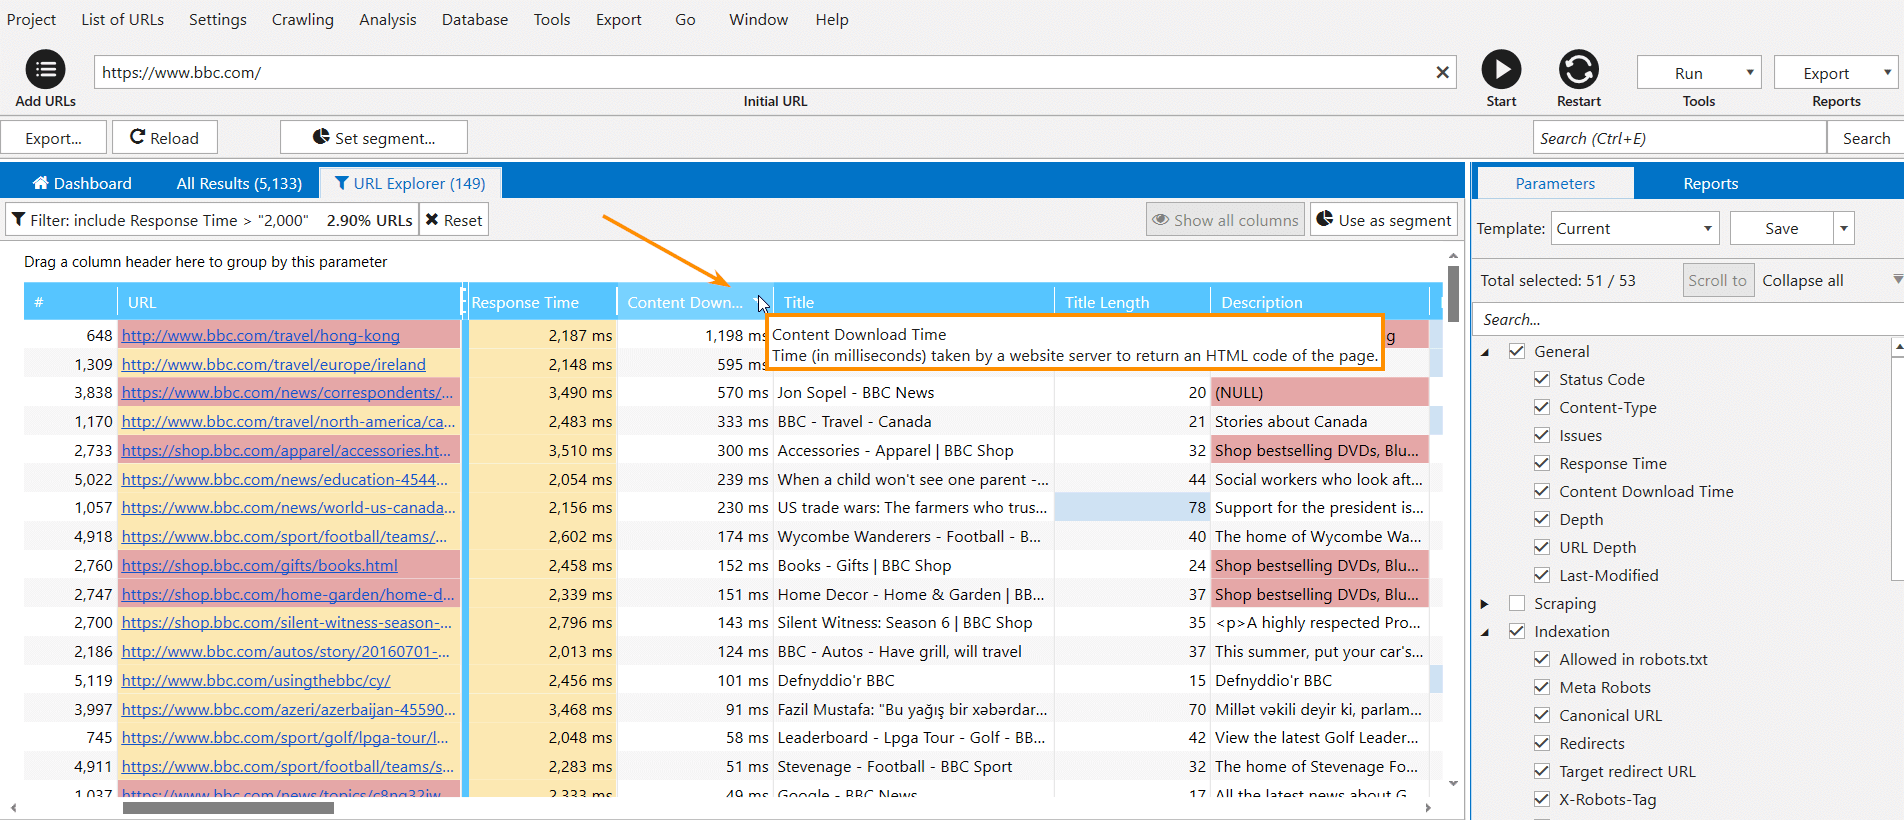
The 'Content download time' column displays the download time of each URL of your site.
You can check load speed and server response time in the free version of Netpeak Spider crawler that is not limited by the term of use and the number of analyzed URLs. Other basic features are also available in the Freemium version of the program.
To get access to free Netpeak Spider, you just need to sign up, download, and launch the program 😉
Sign Up and Download Freemium Version of Netpeak Spider
P.S. Right after signup, you'll also have the opportunity to try all paid functionality and then compare all our plans and pick the most suitable for you.
3. How to Speed up Your Website
As we have already seen, a lot of parameters can affect the website load speed. So we've divided the optimization process into:
- optimization of HTML / CSS / JavaScript code
- optimizing server response speed
3.1. Optimizing Client Code
You could face such situation when the page has already loaded, but multimedia elements are still unavailable for viewing. The more content and different styles on the page of your site, the longer it will be loaded. To optimize the client code, we suggest the following simple recommendations:
- Compress media content on your website. So you can reduce the size of the transmitted data to 90%. Compress images using special services, for example, Tinypng. This service will help reduce the size of the image without significant quality loss. Also, you can download video not on the site, but on video hosting (Youtube, Vimeo, etc.).
- Use the browser caching. Some resources can be cached to load previously saved versions from the local disk, rather than from the network.
- Optimize CSS. Combine it into one file and use SDN.
- Combine all JavaScript into one file. Similar to combining CSS files, this JavaScript optimization will reduce the number of HTTP requests required for page loading. Use the Single Page Application.
There are many tools that will help to cope with these tasks.
3.2. Optimizing Server Response Speed
According to Google, the server response time should be less than 200 ms.
- Configure nginx (in conjunction with Apache + mod_php, php-fpm or IIS) to execute server logic. With this setting, you can reduce the processing time for queries to static files.
- Configure the caching of the client code. You can do this using such cache managers as: APC, OpCache, xCache.
- Check the script execution delays. After the previous steps, you can look at the delays of the server logic. The most optimal way is to use server-wide page caching. If this is not possible, you need to configure block caching of the data blocks displayed on the pages (for example, via Memcached).
- Also, try deleting unused data from the database or setting up indexes (to optimize queries).
- If you run a WordPress site, managed hosting can do much to improve your site’s time to first byte. If you're looking to tailor your site’s performance, such guys as Presslabs offers a turnkey solution and can help you improve TTFB.
In a Nutshell
- The page load speed is an indicator of the time it takes the browser to download all content on a certain page of the site. It primarily affects the behavioral factor.
- Do not confuse this indicator with the server response time, which shows how much it takes to get the first byte from the server after the request to it. Based on the results of the research, the server response time affects the position of your site in the search result.
- The page load speed is affected by both the optimization of the server's response and the optimization of the client code. It is recommended to use browser caching, compress images, and use asynchronous scripts.
- Using Netpeak Spider, you can find URLs that need optimization and load longer than others.
If you have any questions, or you want to share your experience – write about it in the comments below ;)
Digging This Use Case? Let's Discuss Netpeak Spider Perks in Person