How to Improve Your Metrics in Google PageSpeed / LightHouse [Demi Murych Talk]
From Experts
![How to Improve Your Metrics in Google PageSpeed / LightHouse [Demi Murych Talk]](https://static.netpeaksoftware.com/media/en/image/blog/post/afde3629/900x300/ns-murych-talk-at-conference.png)
At this year's 8P conference, I recorded a presentation from Demi Murych, a specialist in reverse-engineering and technical SEO.
From this blog post, you'll get insights into how LightHouse measures website performance and what you can do to hone it and leap into the green zone of the PageSpeed Insights test (90-100 score), not being a bright spark in other technical stuff.
- 1. What LightHouse Measures These Days
- 2. What Metrics Assess Website Performance
- 3. What Hinders Website Performance, and How to Handle It
- 4. Website Performance Myths Debunked
- Wrapping Up
1. What LightHouse Measures These Days
Until 2018 everyone had been calculating how fast the website loaded. These days it doesn't matter how fast your website loads. What matters now is how long it takes for a page's primary content to unfold within the user's viewport.
LightHouse doesn't gauge the website load speed. It estimates the render opportunities of the above-the-fold content. Suppose we can estimate the time that takes to download any significant above-the-fold content visible within the viewport that is enough for the user's engagement. In that case, we can treat this time as the criteria to rely on.
LightHouse reads three important timestamps which are retrieved from the browser API during rendering:
- FCP (First Contentful Paint). The time when anything of significance is first rendered, be that a text, foregrounds, background images, SVG, etc., but this content is not enough for full-fledged user interaction.
- FMP (First Meaningful Paint). The paint, after which the most significant above-the-fold layout change happens, web fonts and other hero elements are loaded, and the content becomes useful for the user.
- LCP (Largest Contentful Paint). The largest content elements visible in the viewport can be perceived as complete and ready for interaction.
Our goal is to shift these timestamps closer to the moment when the rendering starts.
Hence, even if the website is stuffed with heavy images and loads for a while (3 seconds or more), but it's well-optimized from the website performance perspective, it can still dwell in the green area of the PageSpeed Insights test.
Read more → Website Speed Test
2. What Metrics Assess Website Performance
This example report perfectly demonstrates how LightHouse really works compared to what you're used to seeing on the PageSpeed Insights website.
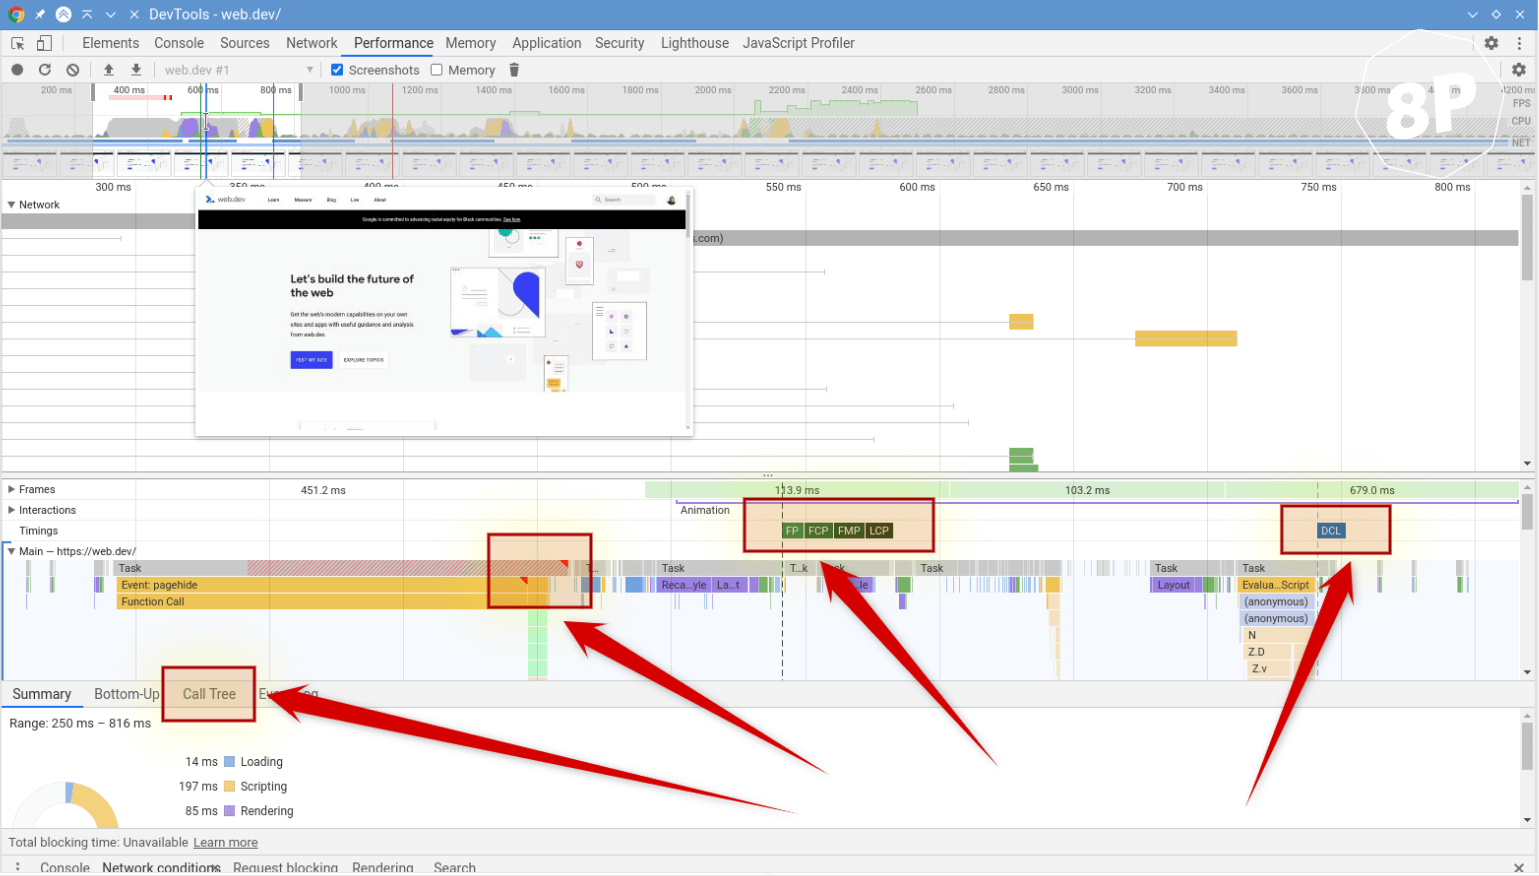
The highlighted four areas show where to channel your attention in this report.
FID, FCP, FMP, LCP on the flame chart are simply the timestamps that mark when something occurs. And the closer these timestamps are to the render start, the better.
All Web Vitals introduced by Google have been in action since 2018.The only thing that changed is their names and the ways of calculating.
Except for CLS (Cumulative Layout Shift), which stands aside. This metric is newly introduced, and the most curious thing is that it has no ties to website performance.
CLS estimates visual stability or how our website 'jitters' when the page loads. For instance, the images and other assets loading can cause the website contet to jump to a different location. But if our website's layout was diligently crafted, it won't 'jitter' at all.
Why should you thank Google for this metric? Now all people without a technical background can show test results to the developer, which says 'your CLS is bad,' a scary figure, red circle, and 'please, do something with it.' And the developer must fix this issue because the ensured quality minimum is CLS = 0.
The bottom line is that all metrics, except CLS, have something to do with website performance, namely, how fast the above-the-fold content unfolds within the visible viewport. The point of CLS is to measure how badly the website 'jitters' when the browser renders its resources.
You can check Core Web Vitals and work with other basic issues in the free version of Netpeak Checker that is not limited by the term of use and the number of analyzed URLs.
To get access to free Netpeak Checker, you just need to sign up, download, and launch the program 😉
Sign Up and Download Freemium Version of Netpeak Checker
P.S. Right after signup, you'll also have the opportunity to try all paid functionality and then compare all our plans and pick the most suitable for you.
3. What Hinders Website Performance, and How to Handle It
3.1. JS, CSS, Media
The most straightforward rule for CSS: if the volume of your page in a compressed form plus the volume of your CSS code in a compressed form amount to 100 kb, no more, you can inline your CSS code into the head section of the HTML page. It’s a muddle-through, but considering both positive and negative factors, it will be an ideal solution in this case.
You may fear that the page will gain weight by precisely the volume of this CSS code and that each time the page loads, this extra chunk of code will load too. What makes it reasonable is that the expenditures on establishing the new connection for loading the CSS file will be larger than the loading of this additional code within 100 kB in a compressed form.
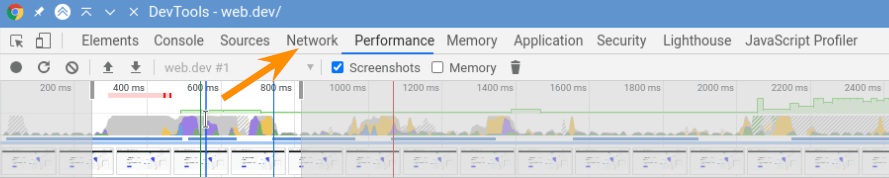
To find out the volume of pages and CSS code in a compressed form, go to the Network tab.
Media and audio should be delayed in loading and used only when they’re really needed.
JavaScript affects the results more than anything else. Here’s the main rule, which will give you a 100 scoring in LightHouse:
- Anything that loads must not.
- Anything that renders must not.
One of the most severe problems of the modern web is that our resources must always establish a connection between browser and server. This task is very resource-consuming.
Let me explain with this simple example: we're mistaken when we import Google fonts and insert them in our project, assuming that they have an excellent CDN, and they're increasingly user-oriented. It's a little white lie. What should you do instead? Download all fonts on your server, where you're keeping a project, change the address in CSS and adjust the loading of these resources locally.
Why? Even if you have an HTTP2 setup, a local server request will be much faster than Google's server. The point is that the moment of connection identification between IP address and your domain address at the first request is already over. And other things that seem to have no sense are those essentials that occur during the loading of any resource: connection establishment, DNS resolving, etc.
The rule is crystal clear: the less JavaScript code is being rendered during the initial page load, the better. Anything that you can delay in loading should be delayed.
Until 2014 the standard prescription was to gather all scripts into one single file. The approach has changed these days: the more script fragments you allow, the faster your website loads. When one chunk of code loads, another one will be rendered. With a bit more work, you'll help distribute the weight between these scripts.
It means that if you open your website now and see that all your JS code loads as one big file, think about how you can change it.
3.2. Iframe: YouTube, Vimeo
These insertions are wide-spread and critical for your website performance.
Any iframe (often it's an embedded YouTube player, Vimeo, etc.) can degrade your website performance from 100 to 0 score. That's why when you see that there's an embedded iframe on your website, think about how you can integrate it and implement the same things without an iframe.
In this case, VideoObject schema markup will do the trick since Google understands it and indexes correctly.
3.3. Google Tag Manager and Google Analytics
The code we're imposed to use on our websites is written in a lousy manner.
By the way, the basic accuracy of these services (Google Tag Manager, Google Analytics) fluctuates within 10%. You can notice it if you insert the counter code at the beginning of your page and run it for a month. Then insert it at the end of the page and run it for a month. The discrepancy will show you give or take 7% of accuracy just within one page.
If the accuracy is not what you're going for, but you aim to track the tendency, this issue can be solved quickly – put the loading of the code far from the page's initial load. If the accuracy is vital for you, take another route – refuse from these services and gather statistics based on your own program analysis.
The bottom line: optimize and distribute the load created by the scripts that strain the processor and make the rendering of the above-the-fold content laggy.
Read more → Increase website speed
4. Website Performance Myths Debunked
It's often recommended: if you haven't implemented HTTP2 protocol, you must do it to enhance performance, and you'll be happy. If the test scolds you for the DOM tree size that exceeds 1500 nodes, you're in trouble. If you use vector graphics, you'll see the light.
Let’s put things in the right order.
1. HTTP / HTTP2
HTTP2 is indeed a breakthrough compared to HTTP. When the HTTP2 appeared, its edge over HTTP was that there was no need to establish tons of connections to download a file.
It may seem like a fabulous idea. So let's jump on the bandwagon and use HTTP2? A little refresher: remember when at some point in the 2000s, we downloaded films though different download managers, which told us about the enormous number of threads from which they start fetching files. They established 5-10 connections to download a file. And you may wonder how it can be fast, the channel doesn't grow bigger when we set more connections. The situation is clear as day: when your channel is getting a little jumpy, it won't affect 4 other connections established even to the same server.
That's why HTTP2 isn't always a magic bullet. Suppose your main audience or significant one is people who open your website using mobile internet and the quality of this internet leaves much to be desired. In that case, HTTP2 is much likely to be your culprit because a one-single limp connection will make the person shut down your website at all. With an HTTP connection, a maximum threat, in this case, will be the unfinished loading of several resources.
Nowadays, the traditional cure-all is to establish 4 HTTP2 connections. But then there's no difference between HTTP2 with 4 connections and HTTP with 4 connections. This point concerns only the optimization of website performance case.
2. DOM Tree Size
If you opened an HTML code of your project, you would see that it includes tags. Each tag is a specific tree node. Every node occupies a large scoop of memory on your devices. The more the nodes, the more memory your website needs on the user's device. The lesser the memory on your device is left, the slower it works.
DOM tree size that has 1,500 nodes total is a very conservative characteristic. People who are serious about optimization can build a project on 3000 an even on 5000 nodes, which will work the same way fast. It's just scaremongering. That's why when you'll hear 'you have 2500 nodes, do something to cut them off', but you inherently don't feel any difficulties from your mobile device, stop worrying about these numbers.
3. SVG Graphics
It's a marvelous thing, which demonstrates the same huge disadvantage. To display vector graphics, a central processor is needed. Quite often, graphics of this kind can strain your processor heavily. That's why no SVG graphics alike.
If you feel that something is going awry with your page, it's a little bit janky, most frequently, the reason is an innocent SVG file 800 byte large. You'd think, how can it slow down the system? Simply due to a particular filter that is used inside this file (you can use various filters inside an SVG file from negative/positive to gradient, and so on). So this single filter can result in the situation when one SVG file holds back the entire page.
This issue must always be hawk-watched because vector graphics is a new fad now (and that's incredible), but you should stop using it recklessly (because it's harmful).
1. How Google PageSpeed Works: Improve Your Score and Search Engine Ranking.
2. LightHouse.
- YouTube channel
- Website: murych.com
- Track updates and useful information on the channel: t.me/seobank
- Reach out in Telegram: @demimurych
Wrapping Up
Website performance isn't the same as the website load speed. LightHouse has little interest in your website load speed. Its focus is mostly on rendering the timestamp, from the initial paint to the moment when the main content becomes visible in the viewport.
All metrics used by LightHouse to measure website performance (except CLS) have something to do with performance, namely how long it takes for your page's primary content to develop in the above-the-fold area within the user's viewport.