How to Crawl Website and Spot Issues with Netpeak Spider
Use Cases

Read more → crawl slow websites
On our blog, you can find many guides and use-cases covering various aspects of work in Netpeak Spider, but it appeared that... the most essential and simplest use-case was still missing. We realized how difficult it can be to fathom out all nuts and bolts of the instrument, that's why we pulled our socks up and explained how to crawl and analyze the website in Netpeak Spider from the ground up.
- 1. How to Crawl Website in Netpeak Spider
- 2. How to See Issues Detected during Crawling
- 3. How to Export Reports from the Program
- 4. Recap
Netpeak Spider crawler has a free version that is not limited by the term of use and the number of analyzed URLs → you can test many program features.
To get access to free Netpeak Spider, you just need to sign up, download and launch the program 😉
Sign Up and Download Freemium Version
P.S. Right after signup, you'll also have the opportunity to try all paid functionality and then compare all our plans and pick the one most suitable for you.
1. How to Crawl Website in Netpeak Spider
The main reasons you may need website crawling are SEO audit and detection of the website's issues. It's no biggie to perform these tasks in Netpeak Spider. You should:
- Copy the website address (which you want to crawl, obvs) and paste it in the 'Initial URL' field.
- A bit to the right hit the 'Start' button.

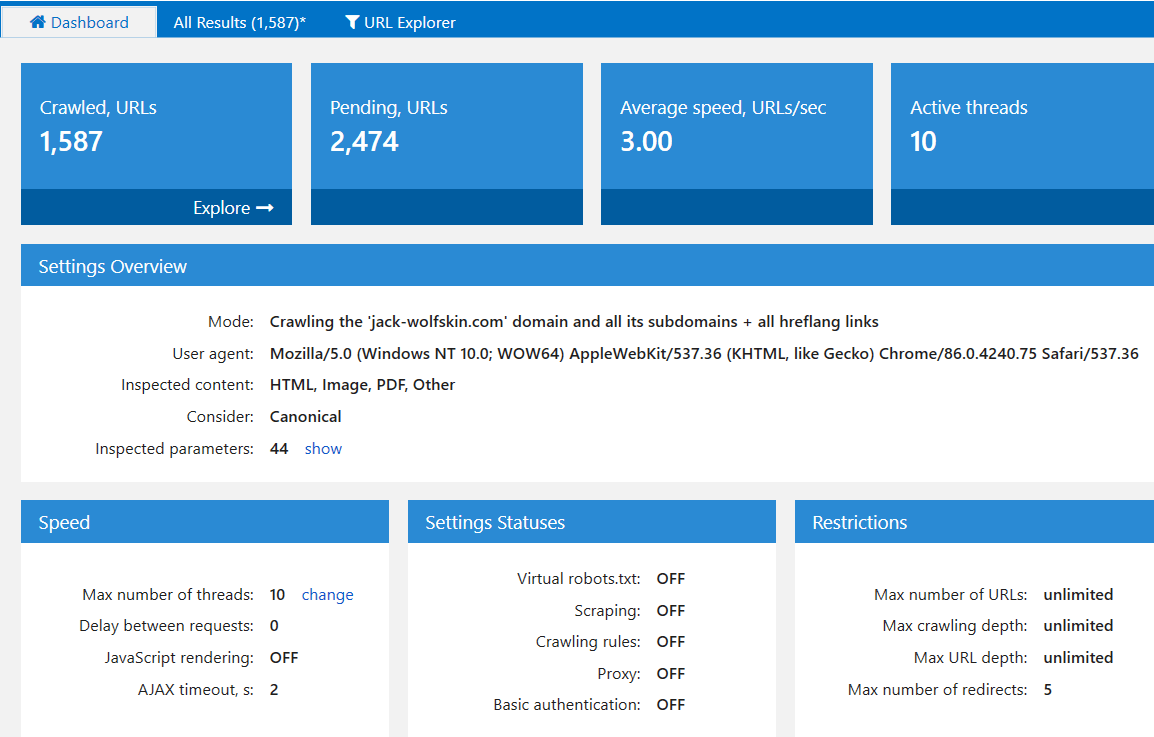
- Watch the crawling process on the ‘Dashboard’ tab.
- You can stop the crawling manually by hitting the 'Pause' button. To continue crawling, click again on the 'Start' button. But if you want to rerun crawling, click on the 'Restart' button. You'll need the ‘restart’ if you changed the program settings and want to crawl the website considering those new settings.

2. How to See Issues Detected during Crawling
First and foremost, wait until the program finishes the crawling and analysis. Then follow the steps:
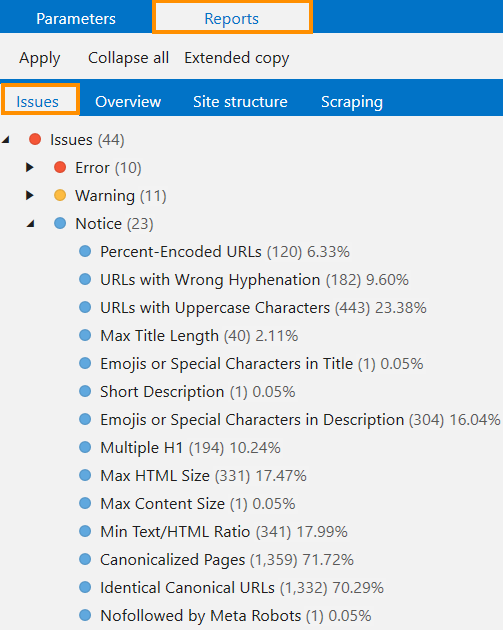
- In a sidebar, open the 'Reports' tab → 'Issues'. Issues marked with red are severe errors, yellow – warnings, and blue – just notices. Not all notices need to be fixed, as some don't pose a danger. For example, pages with emojis in the description may not be a problem, but if emojis aren't supposed to be there, then the program prepares a report that can come in handy.
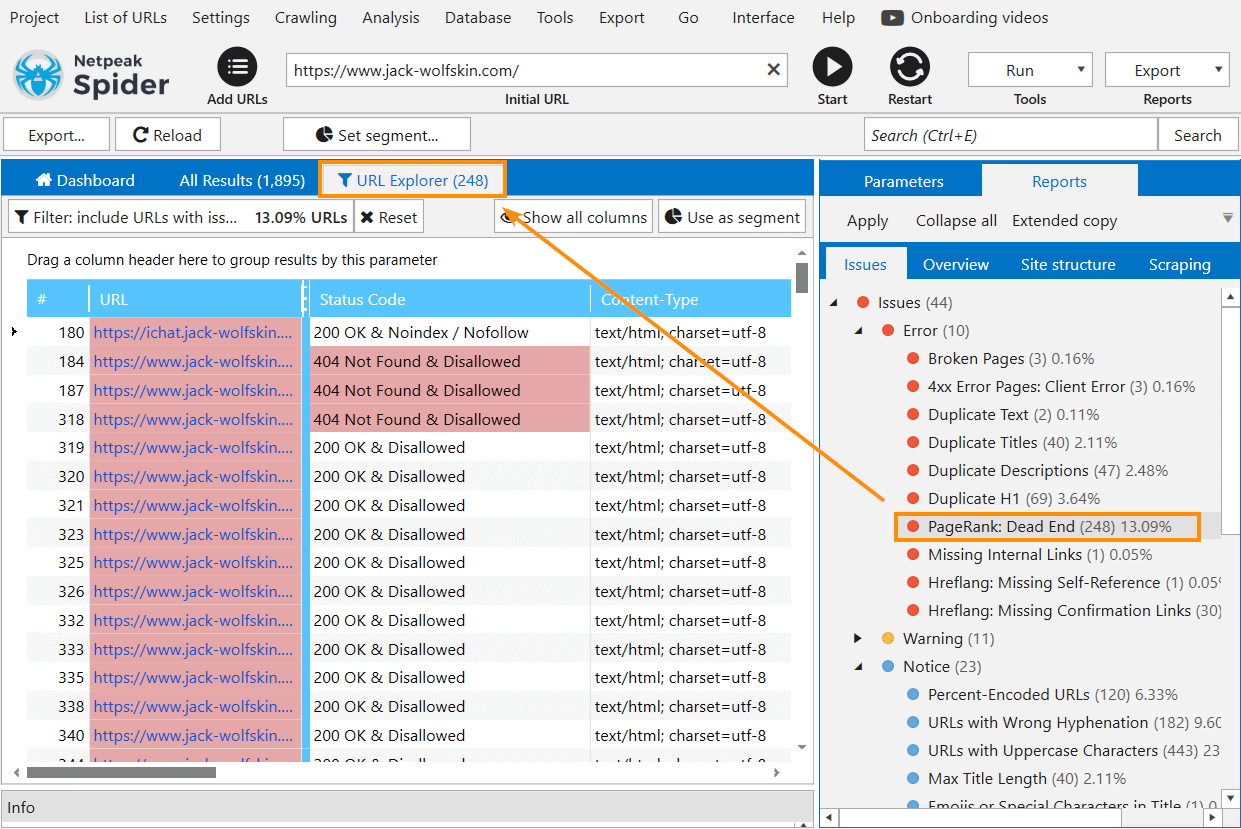
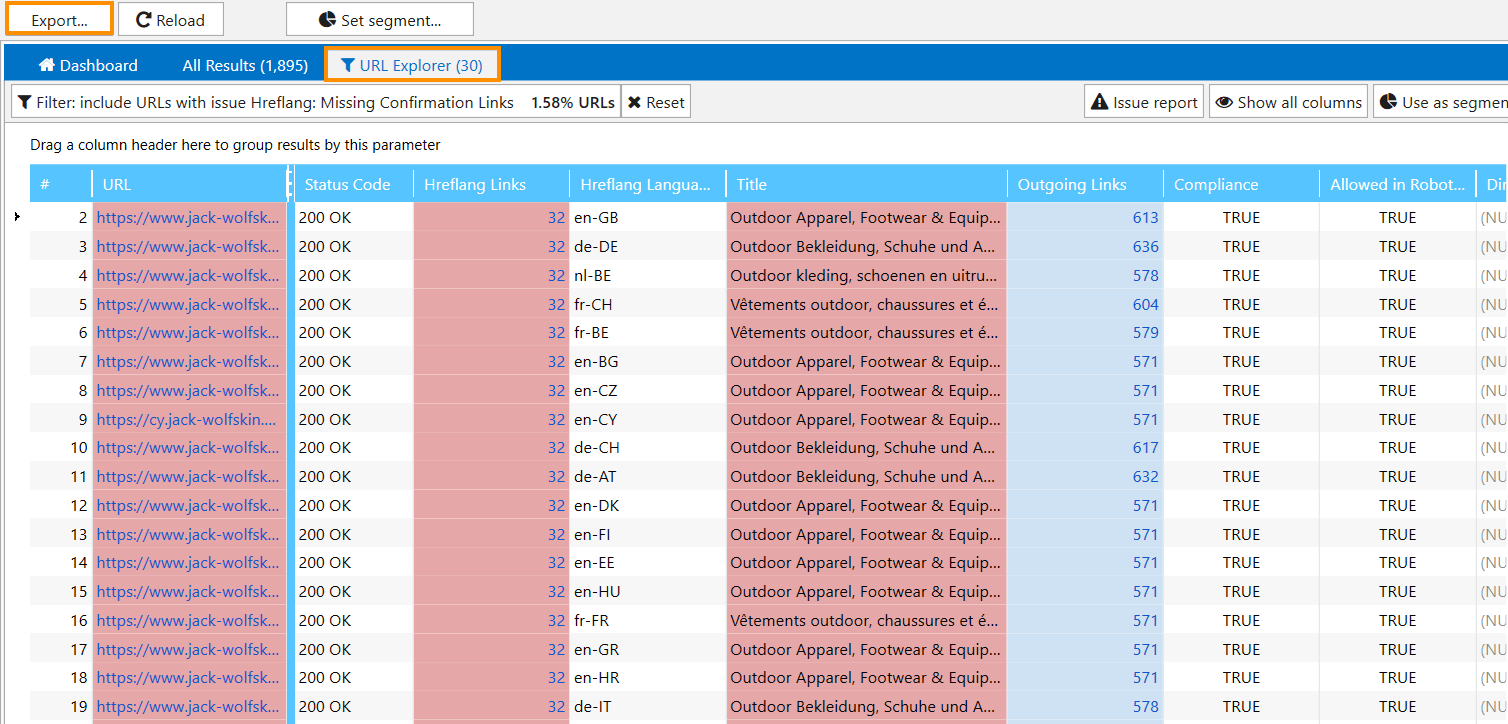
- To see exactly which URLs contain this or that issue, click on the issue itself → the ‘URL Explorer’ tab will bring up the whole list of URLs.
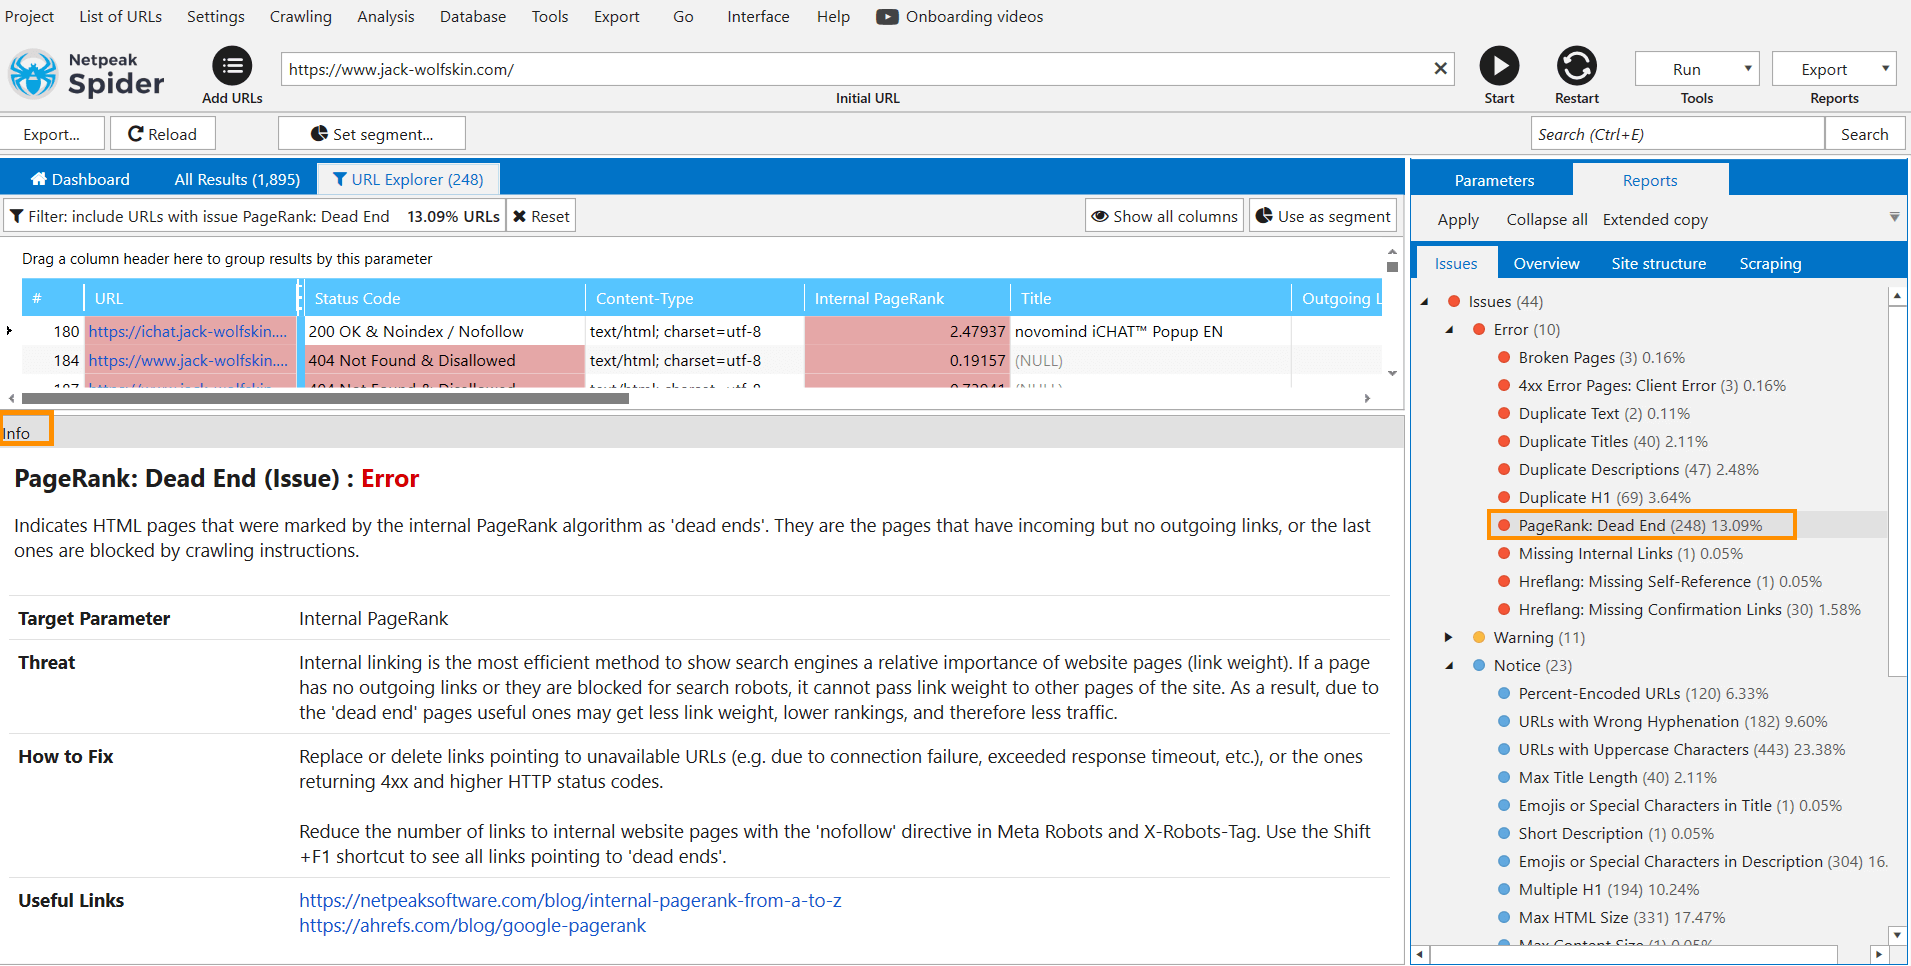
- On the 'Info' panel, you can see what the issue means, what threats it may cause, and how to fix it → to expand the panel, drag it up with a left mouse button. In addition to necessary information, you'll find useful links that you can follow directly from the program and learn more about the issue.
3. How to Export Reports from the Program
Note that you can check the website for issues in the Freemium version of Netpeak Spider and approach the results in the program table absolutely for free, but to save, filter, segment, and export data, you’ll need the paid plan. If you are not familiar with our tools yet, after sign-up, you’ll have the opportunity to give a try to all paid features immediately.
Check out the plans, subscribe to the one most suitable for you, and get inspiring insights!
Here’re several ways to export issue report:
- Having the table with filtered results open, click on the ‘Export’ button → then all results from the current table will be exported.
- Open the ‘Export’ menu on the top panel or in the far right corner.

Using this menu, you can export different types of reports: for example, within a click, you can export:
- All issue reports at once
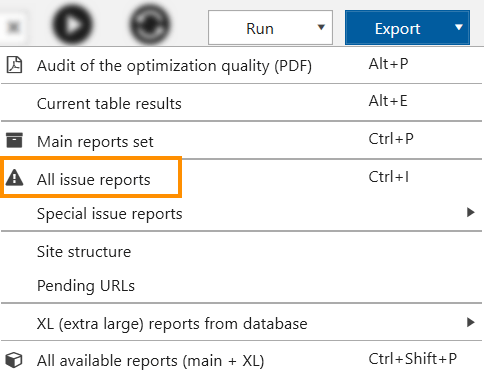
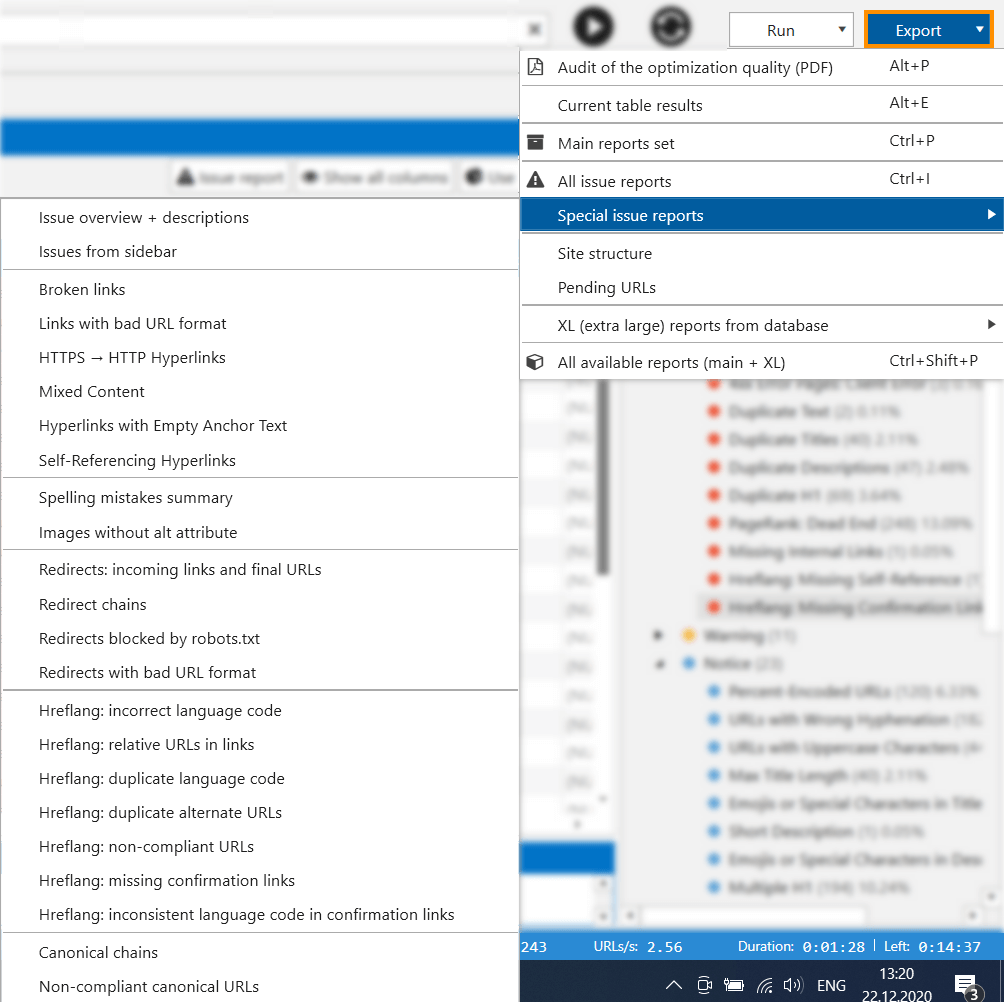
- Special issue reports
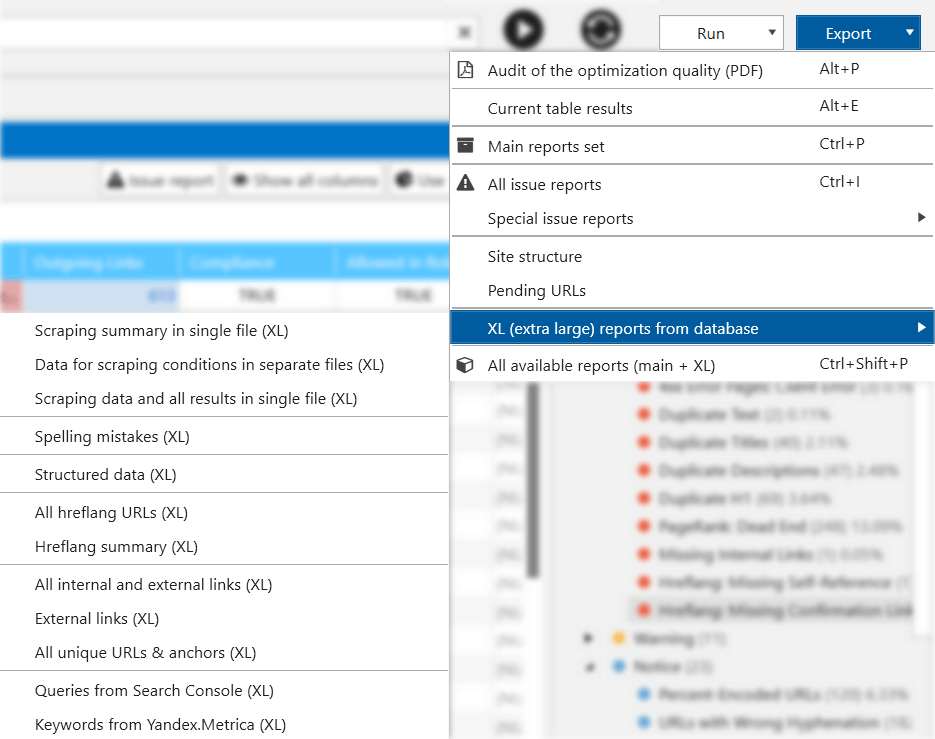
- And also, XL (extra large) reports which contain massive data
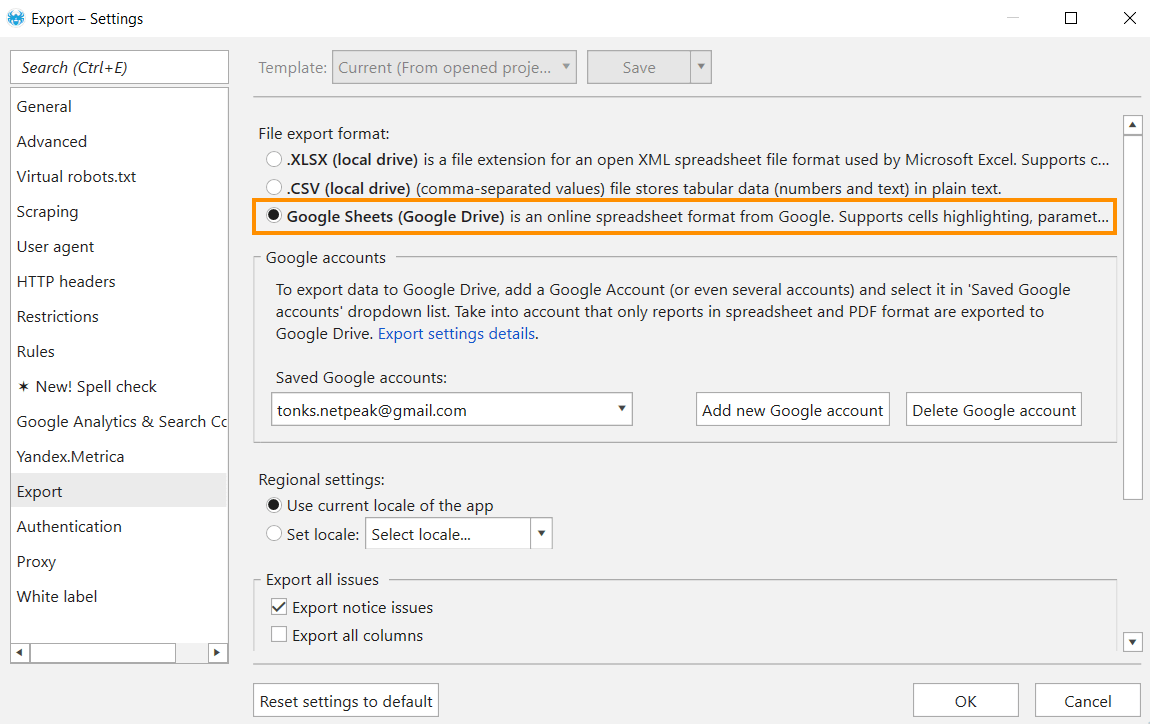
By the way, the Netpeak Spider Pro version owners can export reports and crawl results from the program directly to Google Sheets. To do so, go to 'Settings' → 'Export', add your Google account and in the 'File export format' section, select Google Sheets (Google Drive).
To have access to these and upcoming Pro features, you need to subscribe to Netpeak Spider Pro plan.
I'll showcase the most popular types of reports:
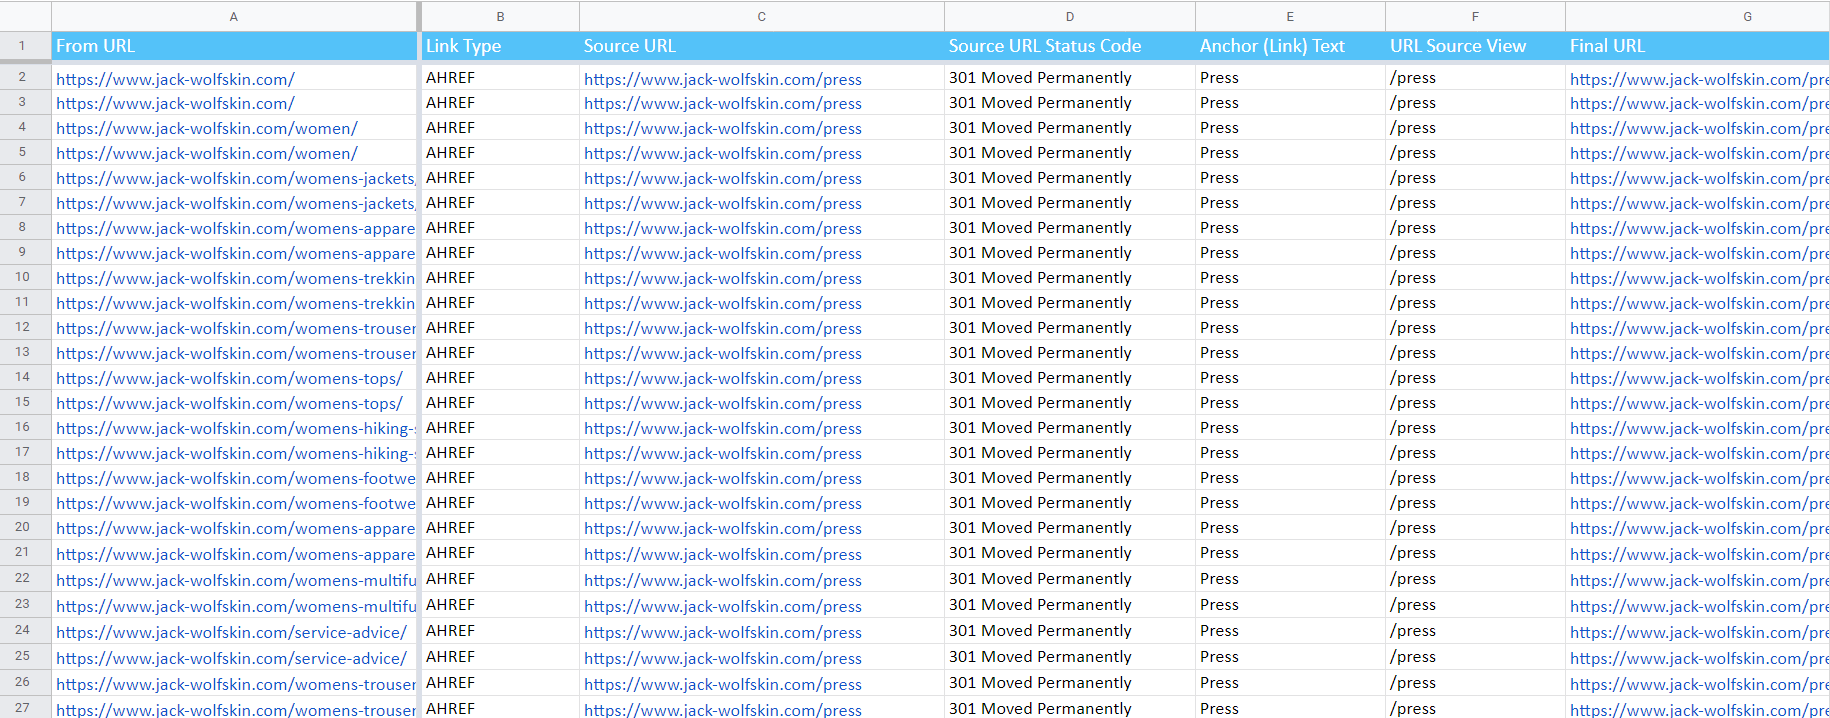
- Redirects: incoming links and final URLs.
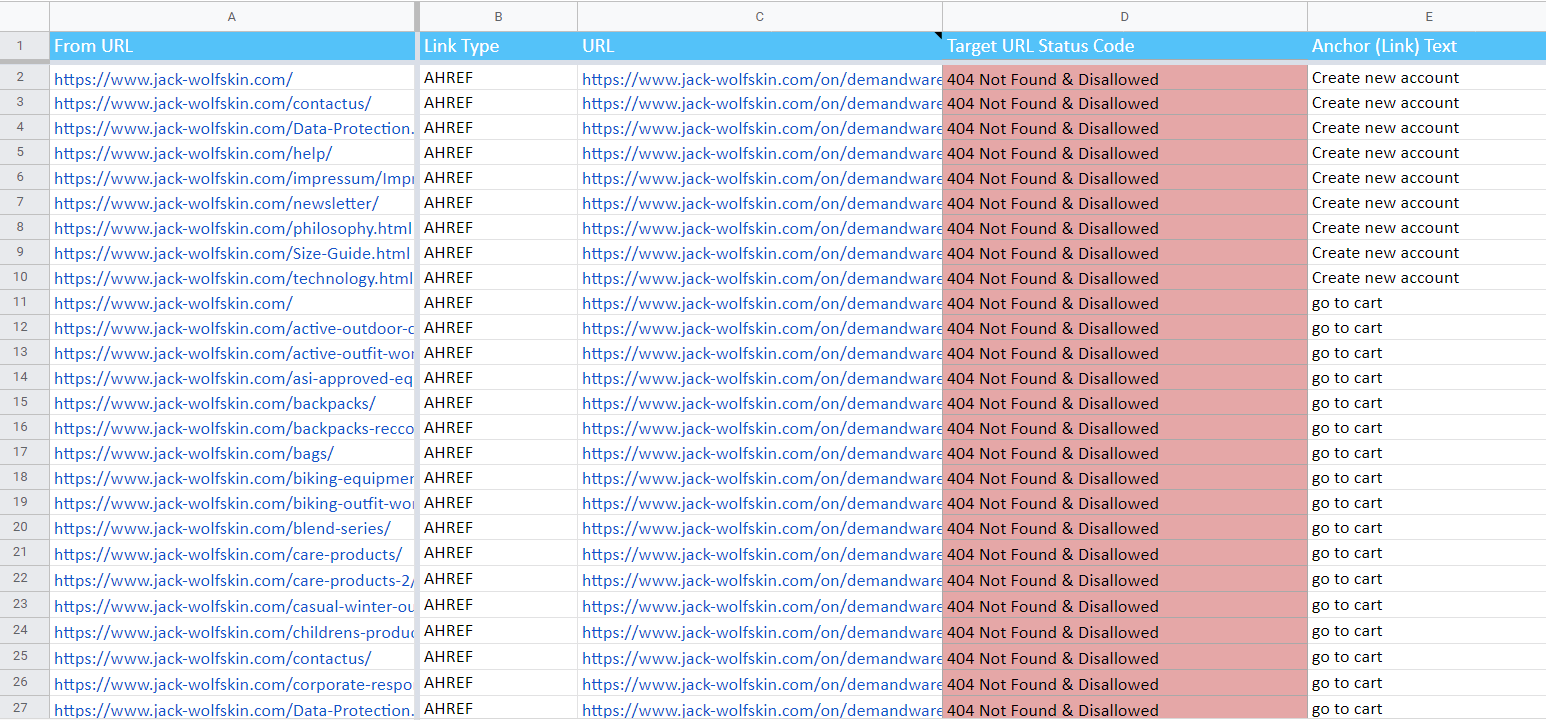
- Broken links
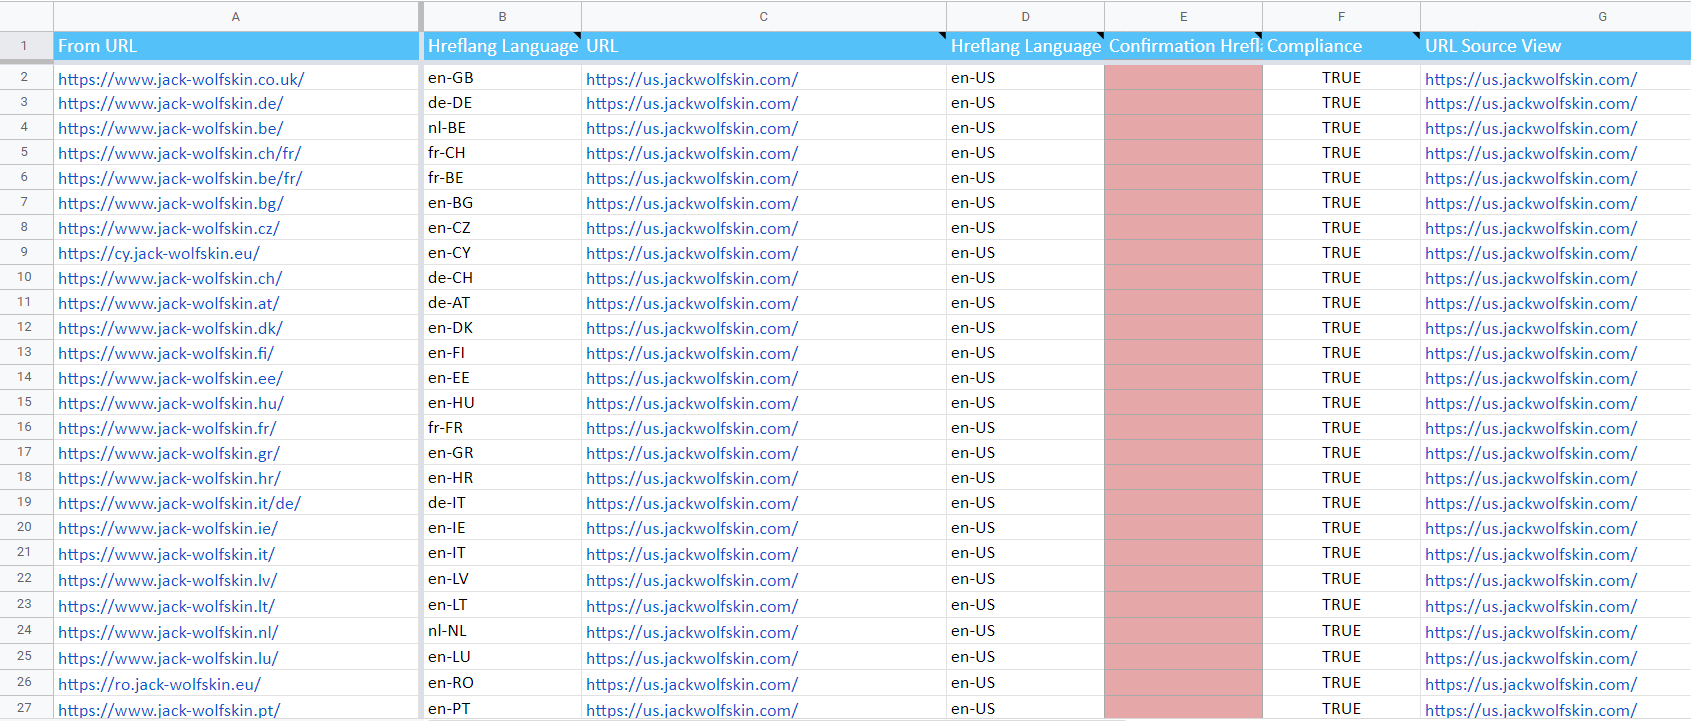
- Hreflang links overview.
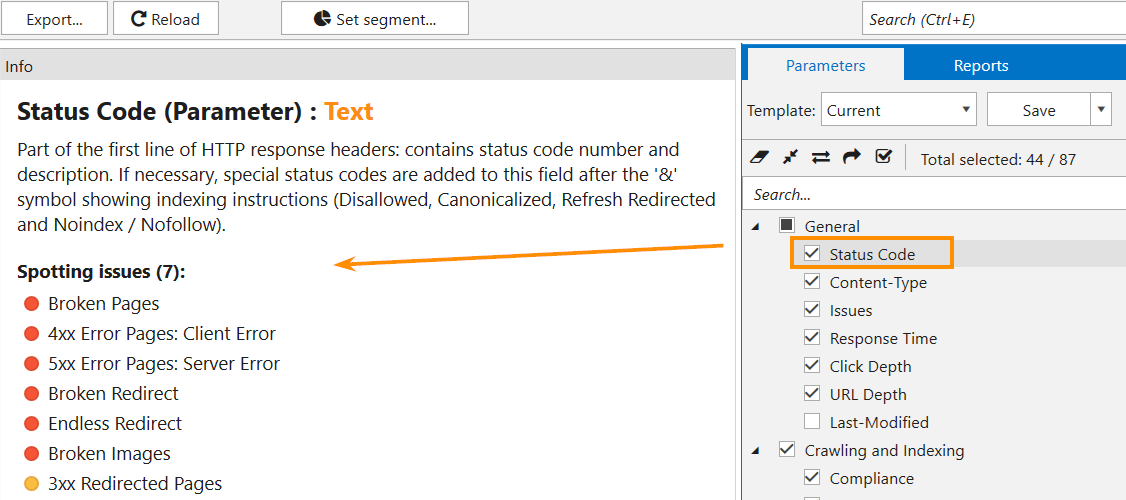
Note that the issues will be detected according to the parameters selected. To figure out what parameters can be checked for this or that issue, go to the ‘Info’ panel → simply click on the parameter and open the panel:
4. Recap
To crawl a website and check it for issues in Netpeak Spider, you need to follow a simple drill:
- Enter the website address into the 'Initial URL' field.
- Launch crawling hitting the ‘Start’ button.
- Wait until the crawling is completed and open the 'Issue' report in a sidebar. Click on the issue name and approach the filtered results → the table will contain URLs that have a particular issue.