Campaign Attribution: Understanding ROI from Your Digital Marketing Initiatives
How to

So you've got tons of leads coming to your website and converting. Great! But, do you know where they're coming from?
Your first instinct may be to check source channels in the 'Acquisition' view in Google Analytics, like it is below.
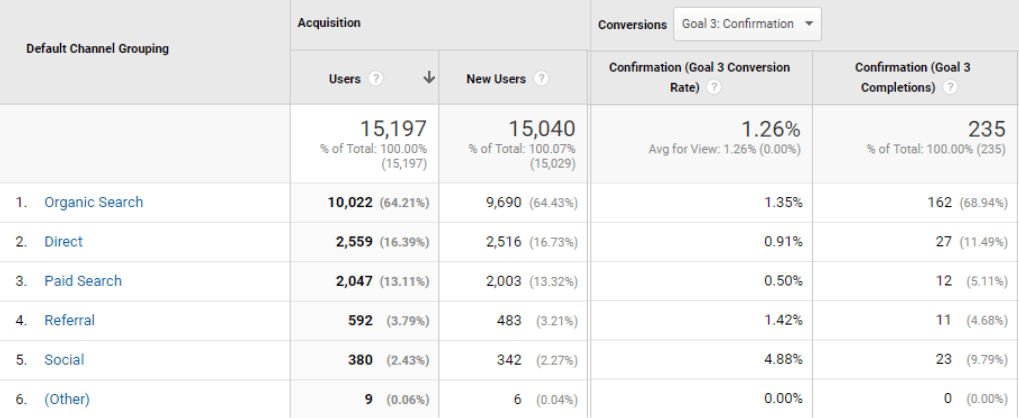
But does this really tell the whole story? What was the channel that brought them to your website first? What was the last one before they converted? Did they visit your site in between conversions?
Unfortunately, the view above doesn't tell you all of that information. However, you can view different attribution models in Google Analytics to see how people are converting across channels and optimize different ones for higher conversion rates.
1. Alternative Types of Attribution
Too often marketers are only using the surface tools in Google Analytics. They view sources by channels and instinctively attribute all the glory to one channel without looking at what really happened behind the scenes.
Here's an example.
Let's say that you're marketing a gym and you sell yoga class packs on your website. Yoga enthusiast Charles sees a post on social media about your yoga classes, comes to your website to look around, and then leaves.
A few weeks later when he decides he wants to get into shape, he types in [your brand name + yoga classes] and finds your site in the SERPs. He buys the class pack on your website.
Now, if you're only looking through the Acquisition → All Traffic → Channels portion of Google Analytics, then you'll see that, by default, Google will attribute that conversion to Organic, as last non-direct click is the default attribution setting in all non-model-comparison views.
What's wrong with this? Well, for starters it completely ignores social media's role in that conversion. As Charles had already been on the website and was familiar with the brand, we can assume it helped with his level of comfort in choosing to buy the classes from your website rather than a competitors'.
Luckily, since we have Google's Model Comparison Tool, we can view all the different attribution types. To find it, go to Conversions → Attribution → Model Comparison Tool. From there we can see what's best for our business model and marketing initiatives so we can craft strategic campaigns and budget accordingly.
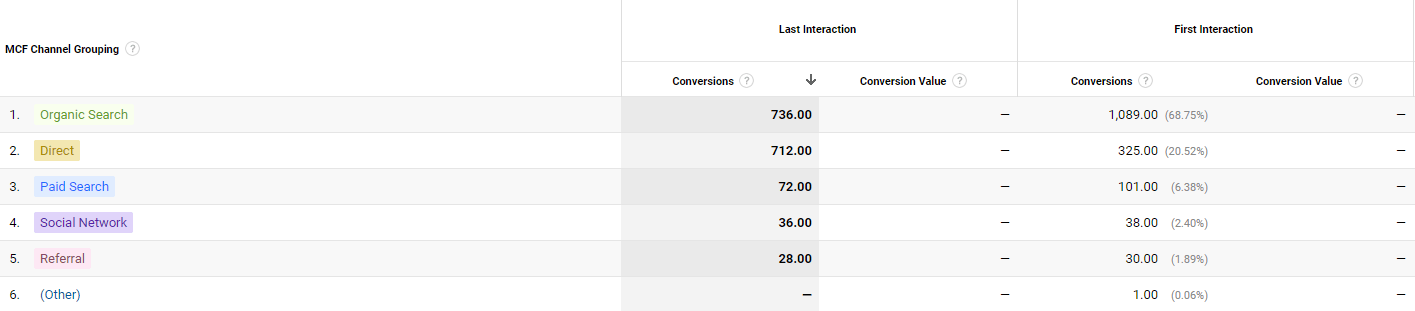
Here we'll go over the types of attribution models and which scenarios they're best used for.
1.1. Last Non-Direct Click
Last non-direct click means that the conversion is attributed to the last channel that wasn't a direct visit to your website.
It's important to stress here that you should use UTMs in all of your campaigns when it's applicable as not using them can result in, for example, email traffic being attributed to the direct.
Use this when you want to know which channels are the best for closing deals. Then you can optimize more bottom-of-the-funnel (BOTF) content for these channels.
1.2. First Interaction
First interaction means that this channel was what brought the converted prospect to your website.
If your brand is a household name or you're doing advertising that's non-digital, then this is an important metric to monitor.
Use this model when you want to know which channels are bringing you new customers. You can optimize top-of-the-funnel content here to raise brand awareness and cycle them through with content to move them down the funnel on their next few visits.
1.3. Last Interaction
Last interaction is the same as last non-direct click, but it factors in direct visits.
Use last interaction when you want to know which channels are the ones that are closest to conversions.
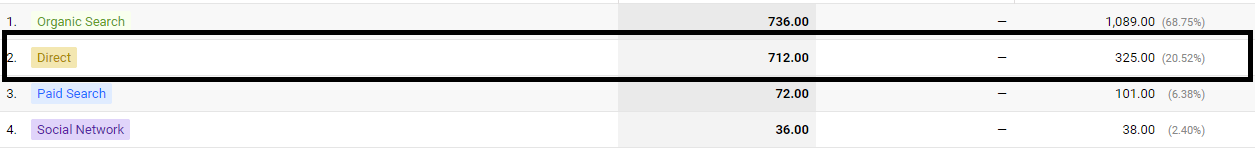
Notice how 'Direct' takes a huge jump when it's last interaction versus first interaction. After prospects have become comfortable with your brand, they typically remember your website address and come back to convert.
1.4. Position Based
Position based is a point system which assigns value to the first and last channels that were interacted with (usually 40% for each) and splits the remaining value among the channels in between.
This is a great metric if you want to understand top-to-bottom conversions and apply a weighted distribution for the entrance and the conversion.
1.5. Linear
The linear distribution model assigns an equal value to all channels that were touched before the conversion.
Linear is a good model if you want to see all the channels that played a role in the conversion cycle. Use this model to make sure that when you're deciding on which channels to optimize for, you don't cut any out that have been contributing with assisted conversions.
1.6. Time Decay
The time decay model attributes points to the channels that were touched most recently to the conversion. It's based on a half-life conversion model, meaning that a touchpoint that occurred within 7 days of the conversion is given half the value of the last-interaction channel.
If your sales cycle is short, then this might be a good metric to look at.
2. Allocating Your Marketing Budget
So now that you know how to track campaign results with a bit more flexibility, it will be time to use the data to help allocate your marketing budget.
First and foremost, it's important to understand what your business needs at that particular moment.
Is it brand awareness, lead generation, or conversions?
Yes-yes-yes, of course, you need all three. But for a moment let's look at different scenarios in which you may need to allocate a significant portion of your budget to one of the three choices.
2.1. Brand Awareness
If you're a fresh company and you need to raise brand awareness, then this is strictly about traffic and impressions, so you will want to pay attention to volume of eyes and ears that hear about your business.
Look at metrics total impressions on search console, traffic per channel, and reach in social media. You don't really need to look at your Model Comparison Tool just yet, as you strictly want to increase the volume of people on your website.
As this should be the starting point for your marketing budget, you want to cast a wide-net that will bring traffic and boost awareness so that you can optimize once you have a decent idea of what kinds of traffic are converting.
Look at different portions of your marketing budget going into:
- Display
- Influencer Marketing
- Adwords
- Sponsored Content
- Social Media Ads
At this point, you're trying to establish what the relevant ceilings are in terms of audience reach per channel for your industry.
With organic and paid search, you'll want to see what the aggregated search volume is per industry, so this will require a significant amount of keyword research.
For influencer marketing, look at the top influencers in your industry and check their amount of followers and the interactions on a few of their top posts. In regard to paid social ads, check the impressions and clicks to see what the ratio of impressions → visits are.
Sponsored content will require you seeing what their traffic is to their website and finding out if this is in fact the audience you want to be targeting. Use UTMs for the post to see the direct effect the post has had on your traffic.
In terms of dollars and cents, feel free to allocate the largest part of your budget to the channel with the largest audience for your industry, but leave a significant portion for the other channels to ensure that you have enough volume to measure significant results from each campaign.
After you've run a campaign or two for each channel, see where the highest return is on those channels and then you have a good idea on how much you'll need to allocate for channels for lead generation and conversions.
2.2. Lead Generation
Allocating your budget strictly for lead generation means that you most likely have a shorter sales-cycle or run on a self-service model.
In this situation, you probably have a decent amount of traffic and can easily scale based on traffic → total conversions, meaning that if you increase your traffic by 100%, your conversions will probably double as well.
Here you'll want to look at the first interaction attribution model and allocate a significant amount of your budget towards that.
For example, let's say that you notice a significant return on two channels: Adwords and Facebook Ads.
Each channel has a conversion rate of 5%, similar cost-per-click, and similar impressions. However, we know that the reachable audience is much higher on Facebook due to your preliminary research and the results of our brand awareness campaigns.
Also, we know that if the traffic is higher for one channel that still retains the same conversion rate, then we can scale accordingly if there's still some available penetration with that audience on that channel.
Given that we have a steady conversion rate, we would then want to increase our spend on Facebook as we know there's a much larger audience we still haven't tapped into.
Of course we still need to measure end-to-end conversions and understand where our higher-paying users are coming from. Yet, for lead generation purposes, it's vital to understand just how much money is needed to penetrate as much of the market as possible.
2.3. Total Sales
If we have a longer sales cycle with no self-service, then we would want to look at channels driving end-to-end-conversions.
You'll need a dynamic CRM for this, one that takes on-site visitors and tracks their entire sales cycle from start-to-finish. Most CRMs will integrate with Google Analytics for this type of tracking. However, it's important to find out what type of attribution they use. For example, Google Analytics uses last-click in default views, but Pardot uses first-click attribution. If you're deciding on a CRM to use, make sure that the platform you choose matches the attribution model of your choice.
Additionally, it's not only important to see which channels bring conversions, but also which channels bring in the types of users that spend more.
For example, let's imagine our CRM uses last-click attribution and we pull the following numbers from sales over the past few months:
| Channel | Budget | Conversions | CPA | Expected Total LTV |
|---|---|---|---|---|
| Adwords | 15,000$ | 30 | 500$ | 48,000$ |
| 20,000$ | 50 | 400$ | 35,000$ |
From the above dummy data, we can see that the cost-per-acquisition is cheaper on Facebook, but acquisitions from Adwords typically spend more and the net gain is higher.
Using this information, we can scale our Adwords spend (if we haven't maxed out our audience yet) and measure the results going forward.
Optimize your budget accordingly to your sales model. If you're relying on a couple home runs each few months to drive your business, then look at total sales and see which channels are driving the most revenue, not just the most conversions.
Then allocate your budget accordingly.
3. Optimization: Putting it All Together
So now you have an idea of what attribution methods might be most appropriate for your business model.
Great! What next?
You should use this knowledge to optimize your website for conversions. I would recommend using Google Optimize or a similar tool for this.
Google Optimize lets you copy certain pages of your website, make changes to them, and then test results.
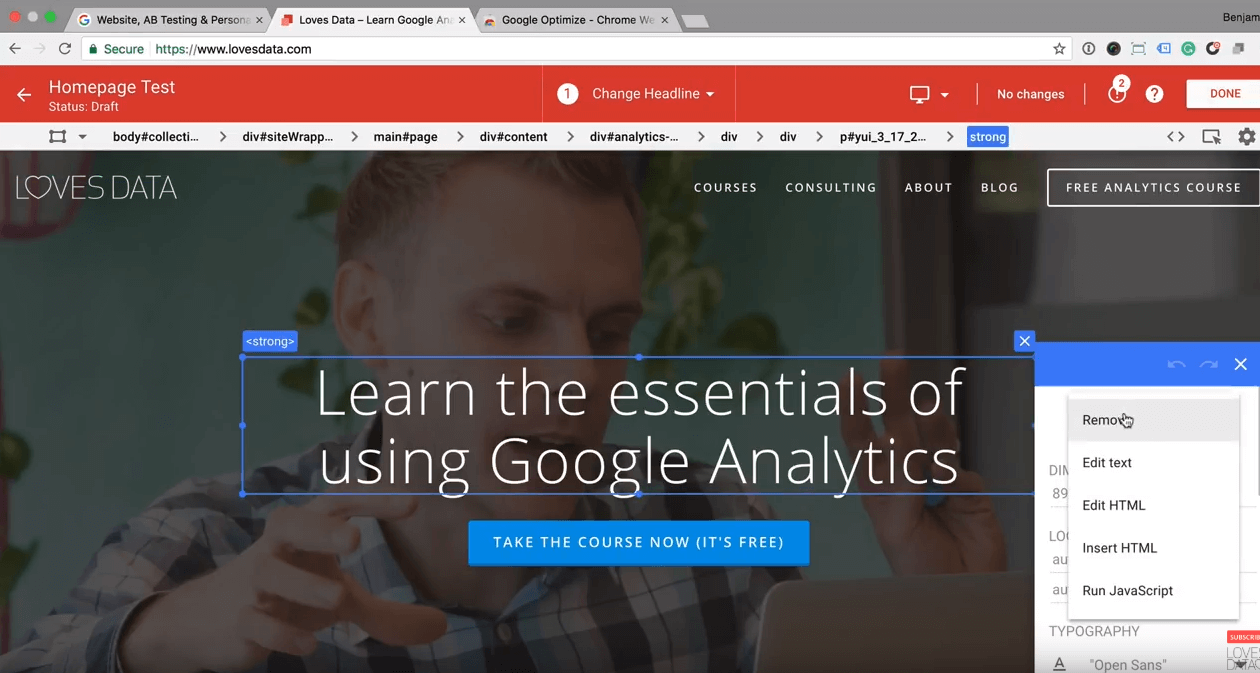
What's cool about Google Optimize is that you can do one of three things per test:
- A/B test different elements
- Run multivariate tests on different elements
- Redirect traffic to a different page
What ties all of these together with campaign attribution is the redirect feature.
Imagine that your best last interaction channel is direct. We can view what the typical conversion path was in Conversions → Multi-channel Funnels → Top Conversion Paths.
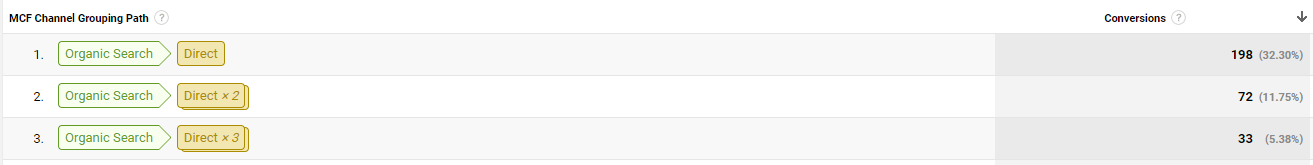
Let's say that a user comes to your blog for the first time. Using the data above, we know that our top conversion paths go from organic → direct.
Using Google Optimize we can choose to display a different version of a page based on user attributes. So if a user comes to your blog the first time, you can let them peruse through and leave. But the second time, if it's a direct visit, you can choose to show them more bottom-of-the-funnel content on your sidebars, in your headings, etc.
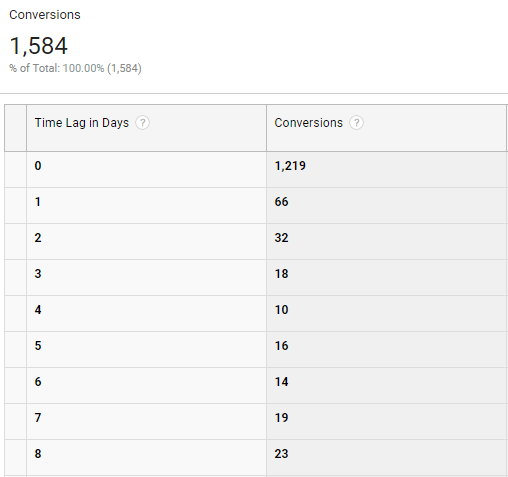
This way your capitalizing on the data you have to try to double-down on the conversion path that has worked so well before. You can set up the parameters to be for users on their 2nd, 3rd, 4th, or even longer visit, depending on the time lag between conversions.
These are just a few ideas, but marketers should really use the model attribution data in tandem with Google Optimize to push users down the funnel depending on where the source channel falls with different attribution models.
Conclusion
Utilize the model attribution comparisons to understand the different paths to conversions that users might take.
- Last non-direct click can be used to optimize more bottom-of-the-funnel (BOTF) content.
- First interaction can let you know which channels are bringing you new customers. So you can optimize top-of-the-funnel content to raise brand awareness.
- Last interaction can let you know which channels are the ones that are closest to conversions.
- Position based is a great metric if you want to understand top-to-bottom conversions.
- Linear helps to see all the channels in conversion cycle.
- And time decay model attributes points to the channels that were touched most recently to the conversion.
Also, make sure you have someone who can iterate on changes to your site with Google Optimize. And, of course, test always and often.