How to Create a Killer SEO Dashboard in Google Data Studio [Simple Guide]
How to
![How to Create a Killer SEO Dashboard in Google Data Studio [Simple Guide]](https://static.netpeaksoftware.com/media/en/image/blog/post/62ed4e1f/900x300/how-to-create-a-killer-seo-dashboard-with-google-data-studio.jpeg)
Have you come up against the following situation? You create an SEO dashboard in Google Analytics, so you and your team can get an idea of how your blog is performing at any given time.
Things are great for a few weeks. Everyone checks the dashboard daily – it's a lifesaver! But after a few months, your beautiful dashboard collects dust in the rarely used customization tab in Google Analytics.
Why? Because people have questions the dashboard didn't answer:
- Which keywords bring in the most clicks
- Which keywords have high impressions but low clicks
- Which pages/posts have the most links, etc.
Unfortunately, there's only so much Google Analytics can do on its own when it comes to SEO.
But there's good news. You can create a new dashboard that does have everything your team needs to know about your SEO with Google Data Studio.
GDS lets you add data from both Google Analytics and Google Search Console to make the ultimate SEO dashboard. And it's super easy to do.
5 Simple Steps to Creating an SEO Dashboard with Google Data Studio
1. Determine Your Key Performance Indicators (KPI's)
Before we dive into Google Data Studio, you need to know how you'll measure SEO's impact on your business.
I'm not talking about only rankings and traffic – I'm talking about metrics that show you how much money SEO brings in.
Here are some SEO related KPI's to consider:
- Sales from SEO (Ecommerce)
- Newsletter signups / email list opt-ins
- New visitors
- Contact forms submitted
Once you've picked a few that make sense for your business (and you set everything up in Google Analytics), you're ready to make your dashboard.
2. Connect Your Data Sources
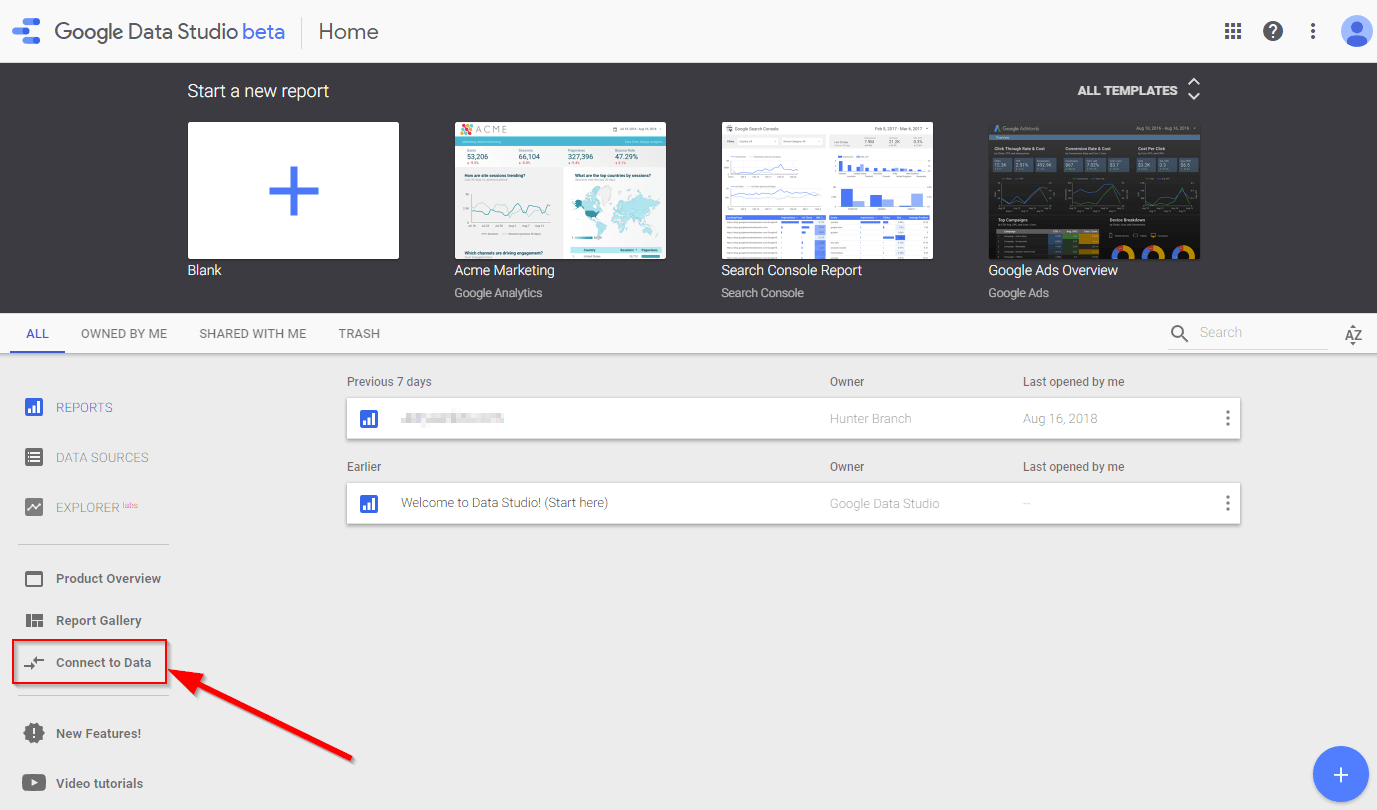
- Go to Google Data Studio and sign in with your Gmail account.
- Click on Connect to Data on the left tab.
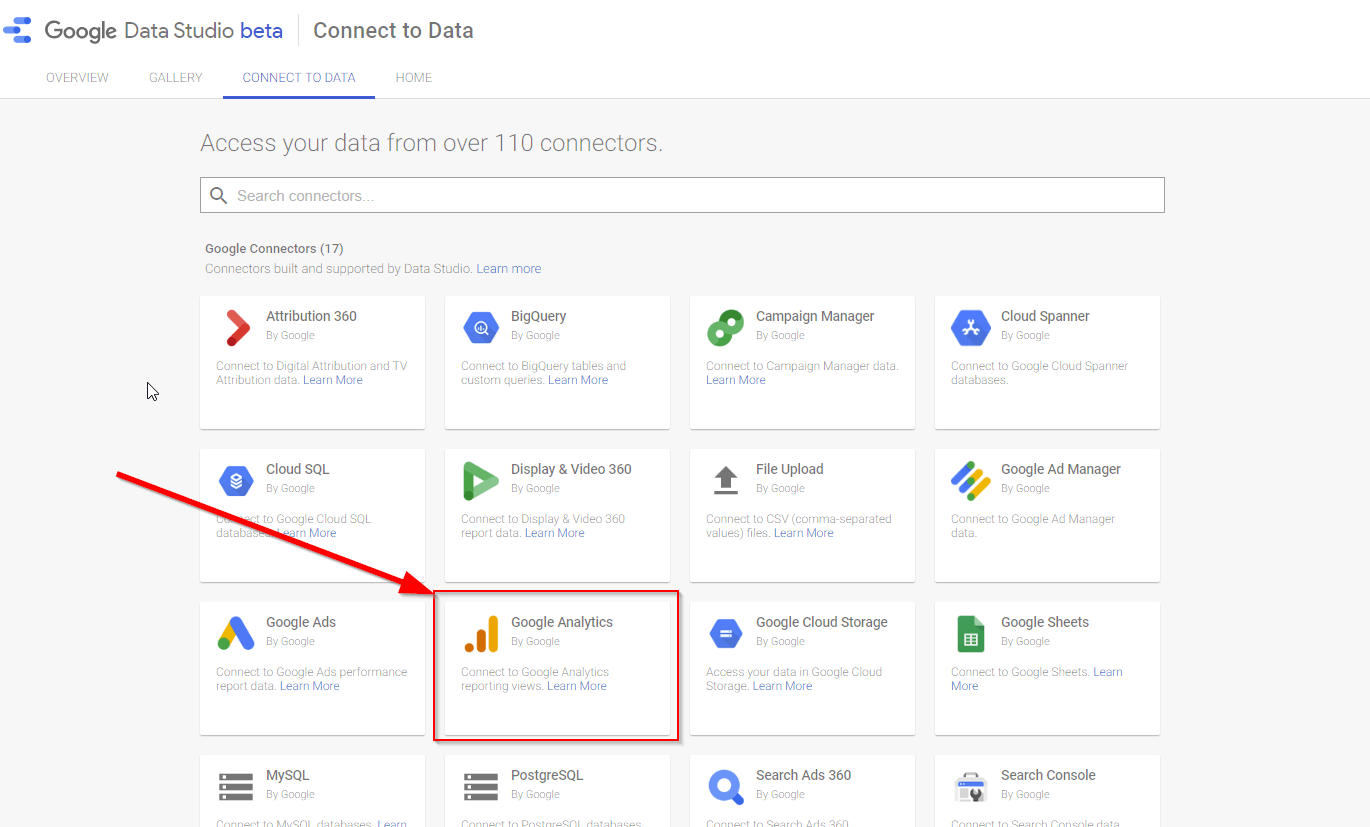
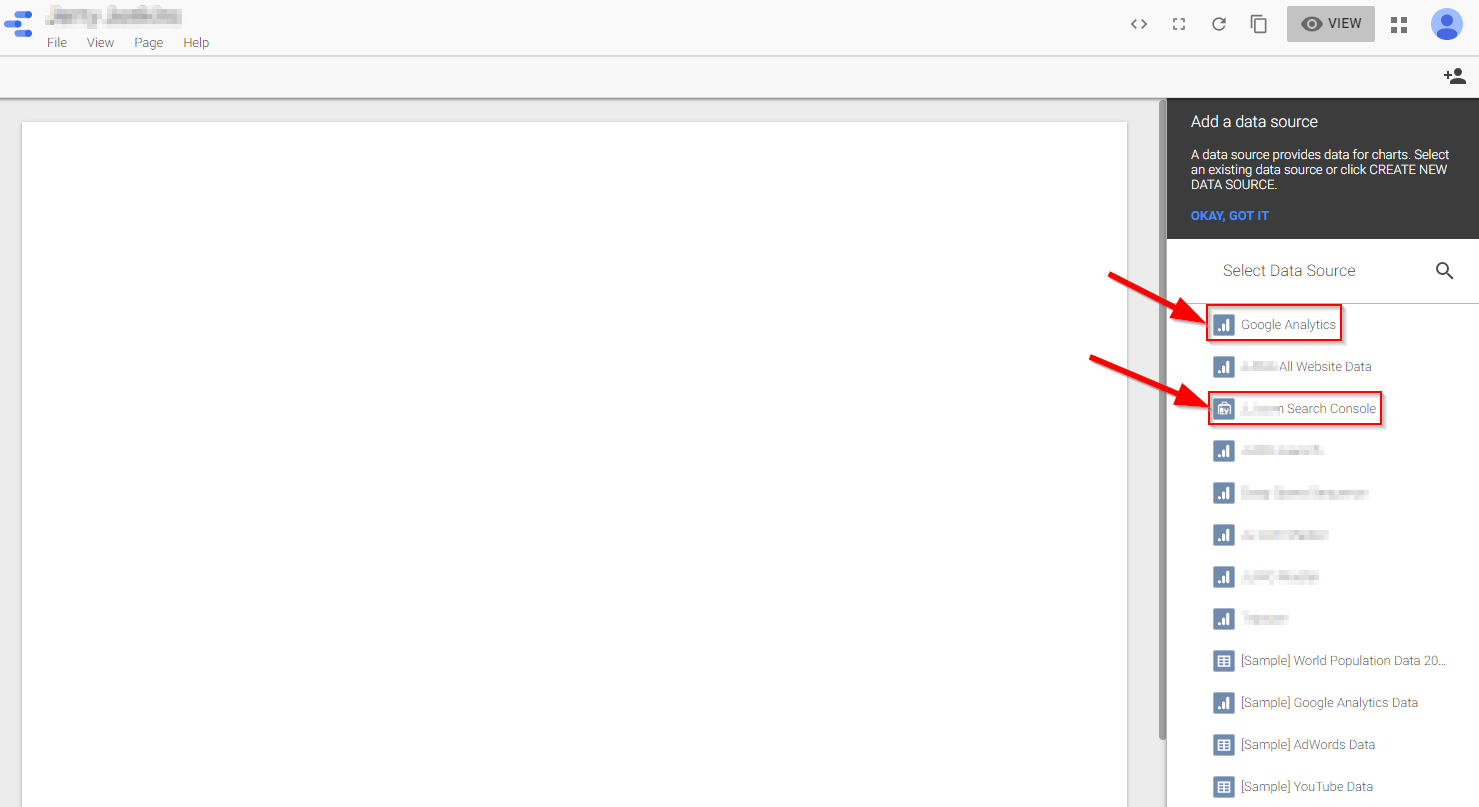
- Select the Google Analytics connector, then the account, property, and view you want to connect to.
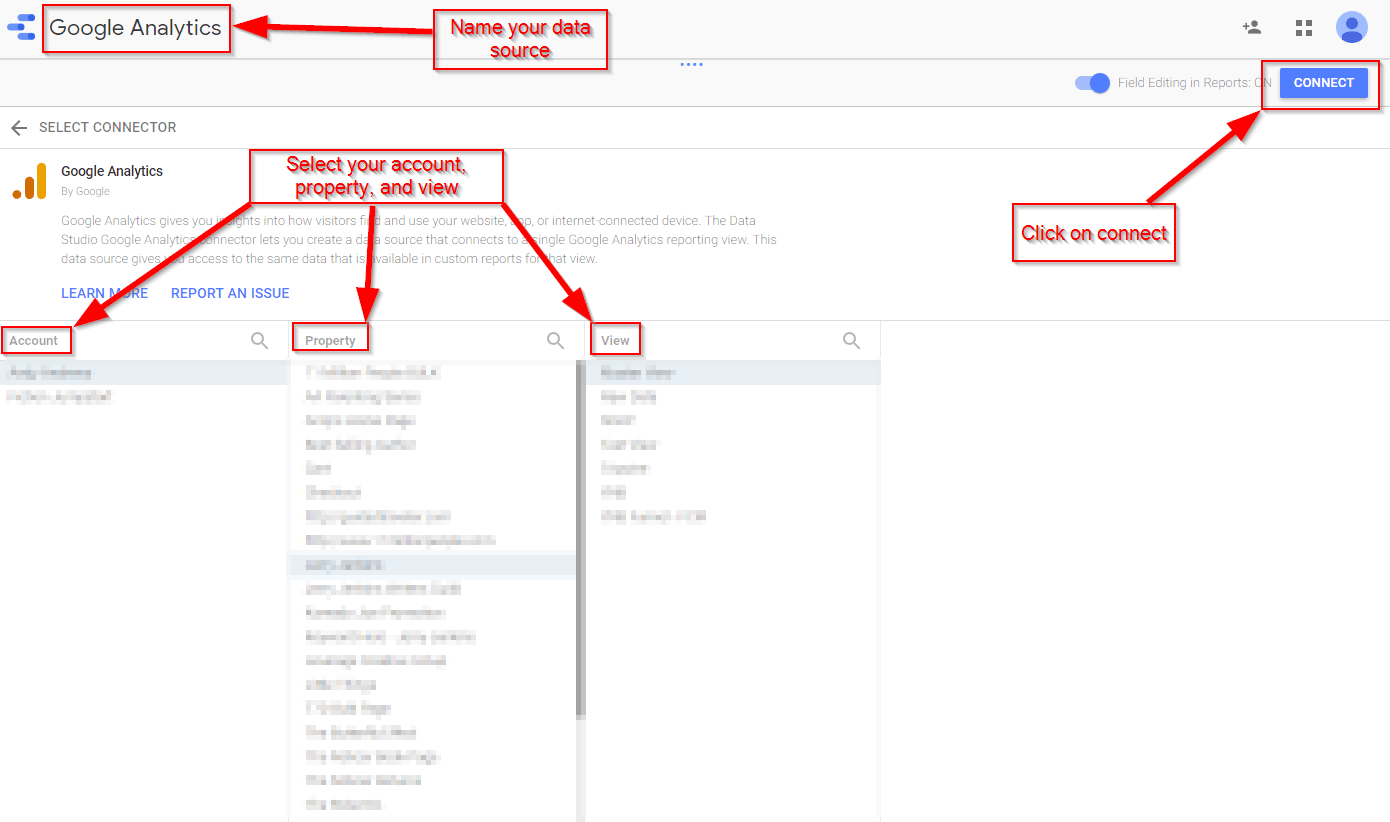
That's all there is to it. :)
Next, just repeat the process for Google Search Console and you'll have all the data you need to create your SEO dashboard.
3. Add Elements to Your Dashboard
You're ready to make your dashboard awesome!
-
Go back to the main Google Data Studio page and click the plus icon in the bottom right corner to get started.
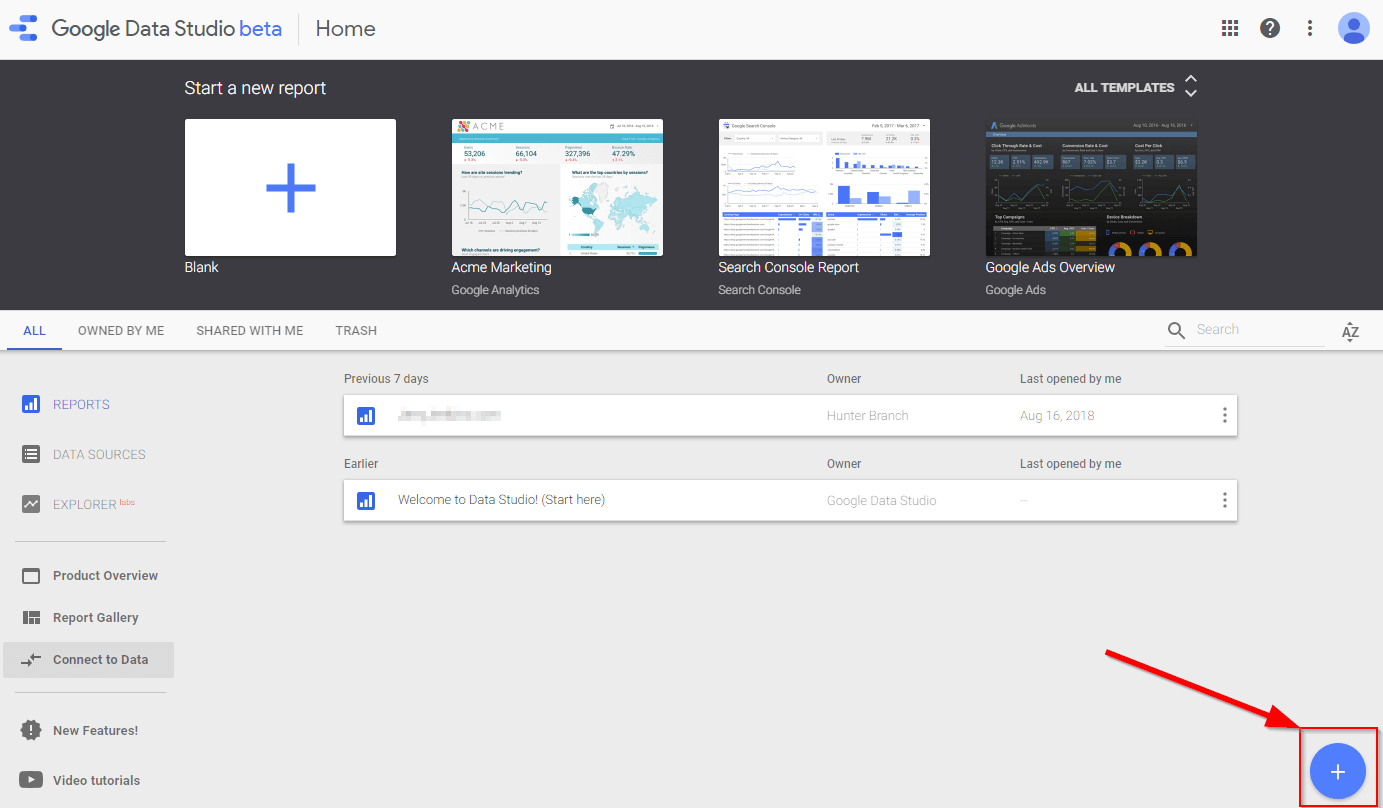
-
Add your Google Analytics view and Search Console account to the report.
Alright, now here's the fun part. It's time to add your KPIs to your dashboard. There are tons of different ways to do this based on the charts and tables available in Google Data Studio, but here's how I recommend setting things up.
3.1. Line Charts
- Total unique visitors over time
- Organic traffic over time
- Newsletter opt-ins over time
- Any other goals directly tied to SEO
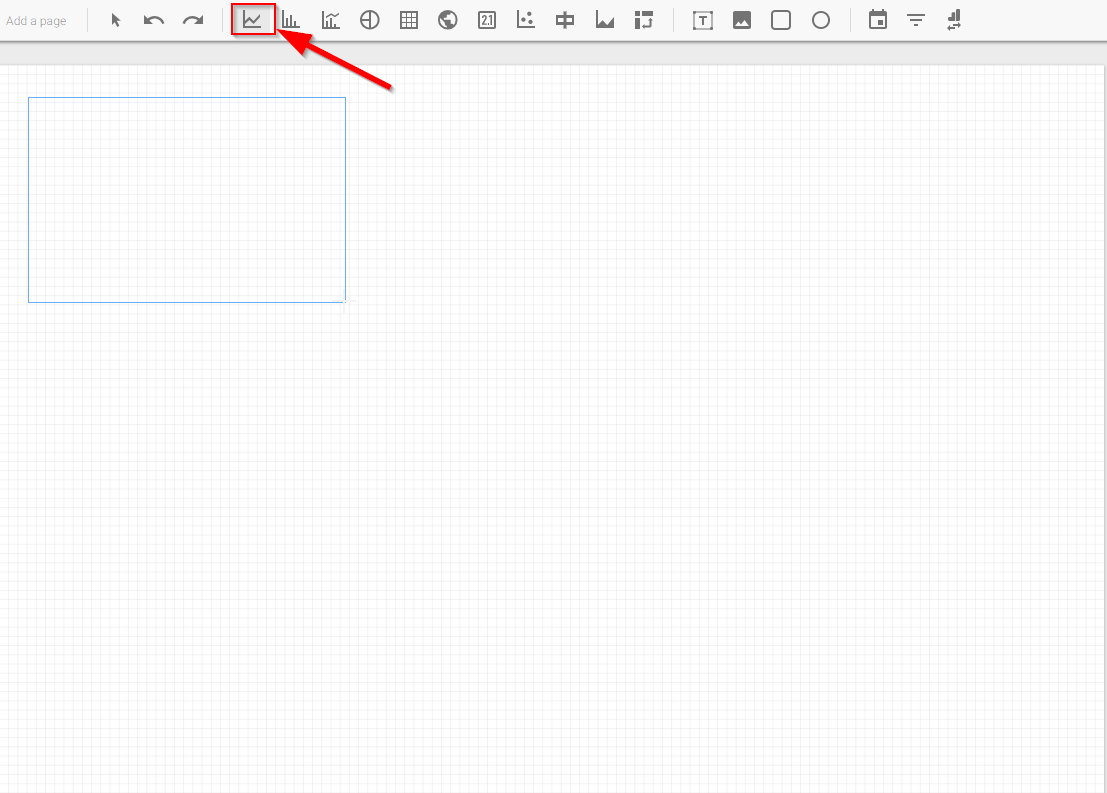
How to Make a Line Chart
- Click the line chart icon in the toolbar, then click and drag in the dashboard area.
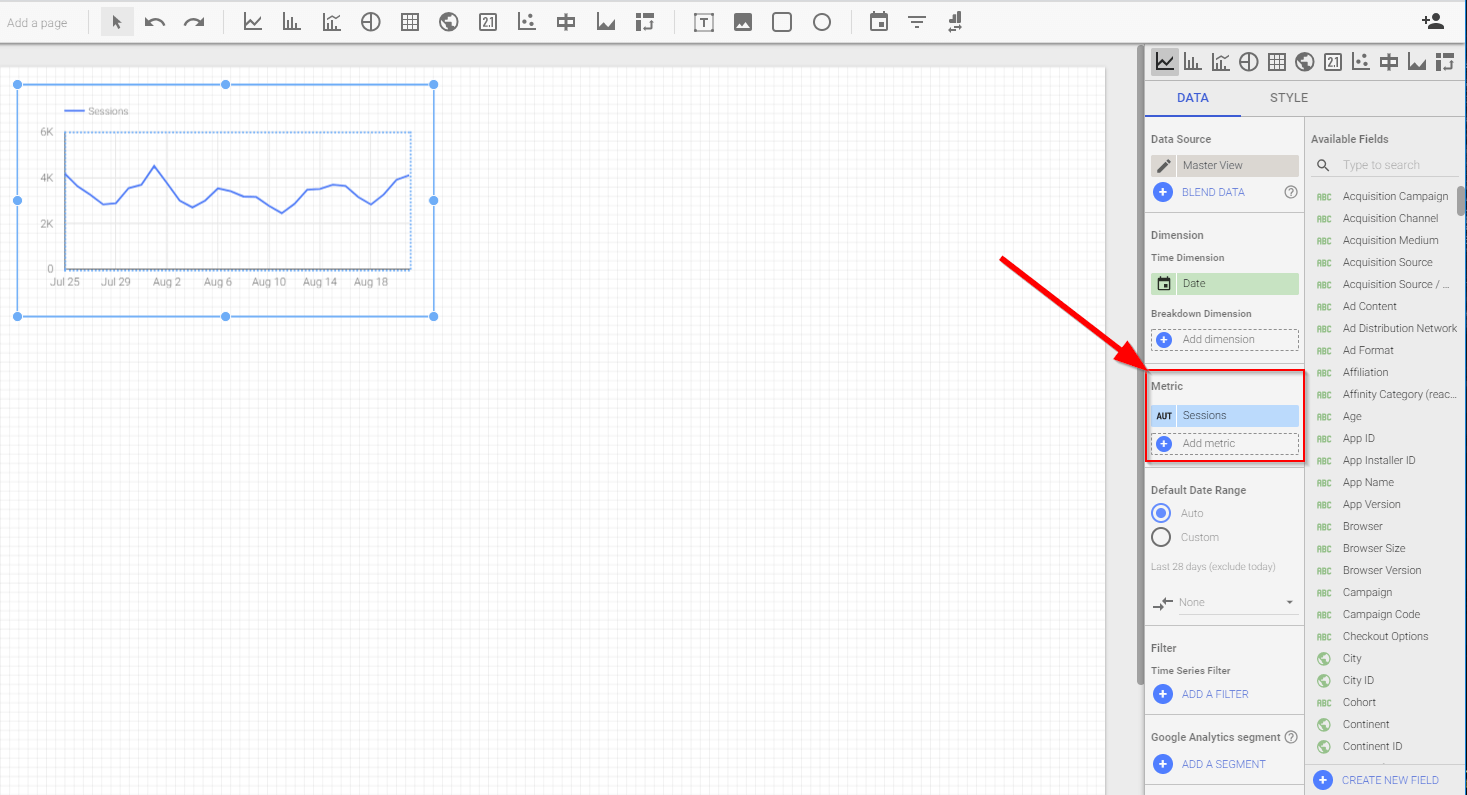
- Select the metric you want to display in the toolbar to the right.
- Add a previous period date comparison.
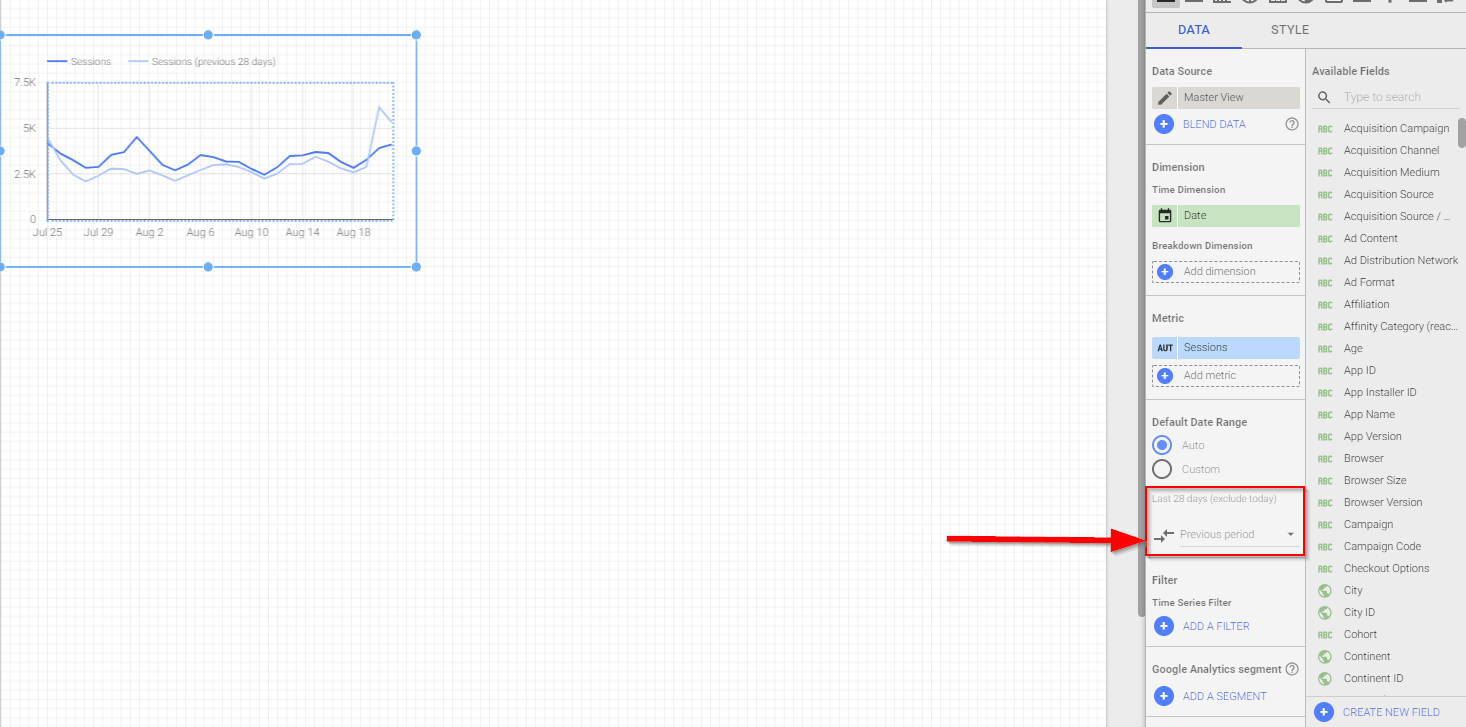
And that's really all there is to it.
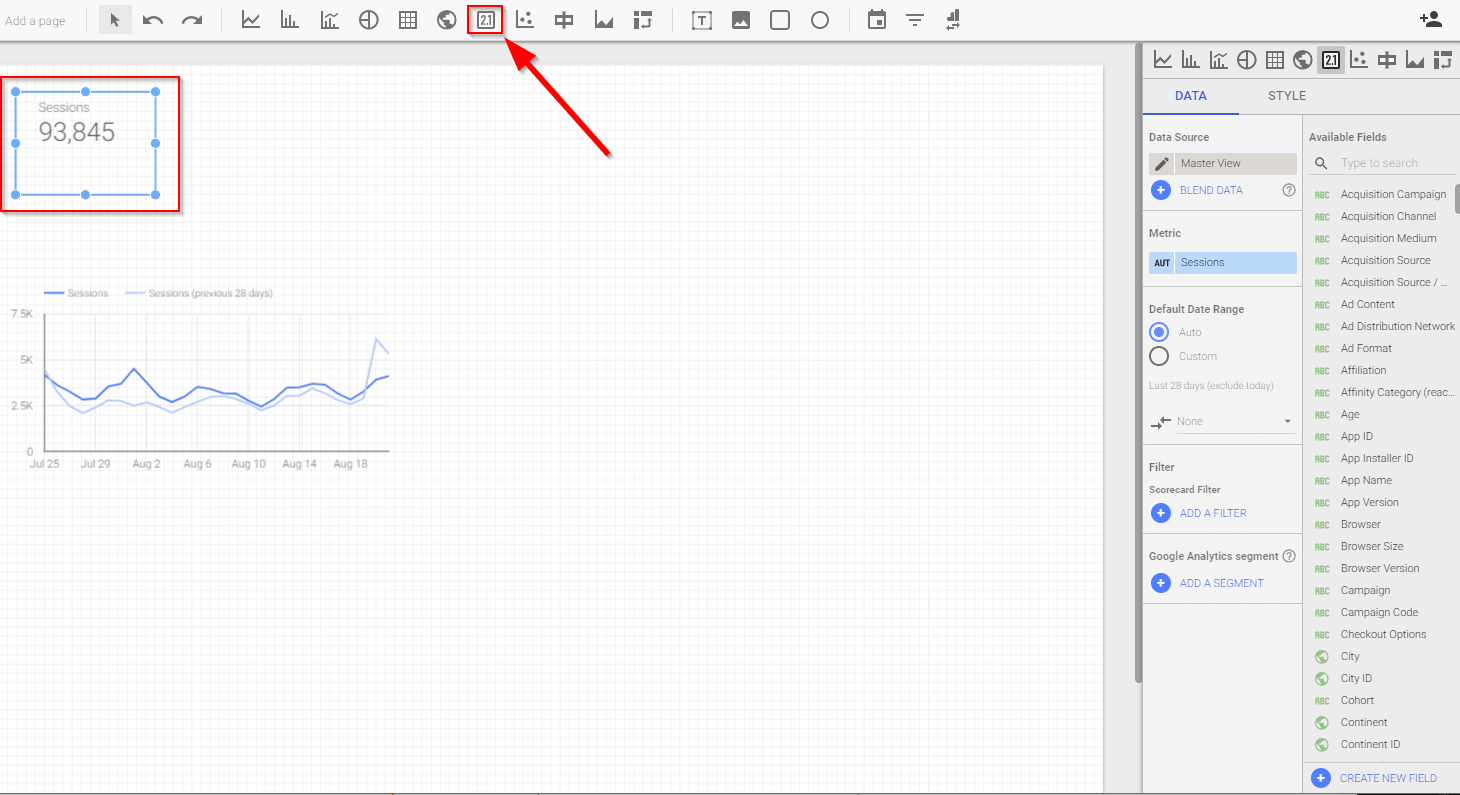
3.2. Scorecards
- Bounce rate
- Avg time on page
- Avg pages per session
- Unique visitors
- Organic visitors
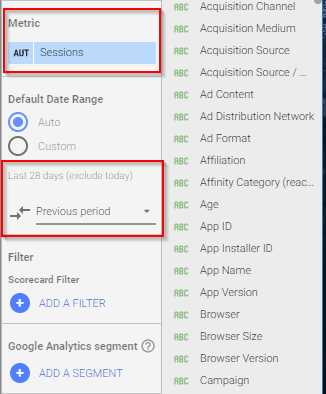
How to Make a Scorecard
All you need to do is:
- Click the scorecard icon from the toolbar
- Click and drag in the dashboard area
- Pick the metric you want to display
- Add a previous period date comparison
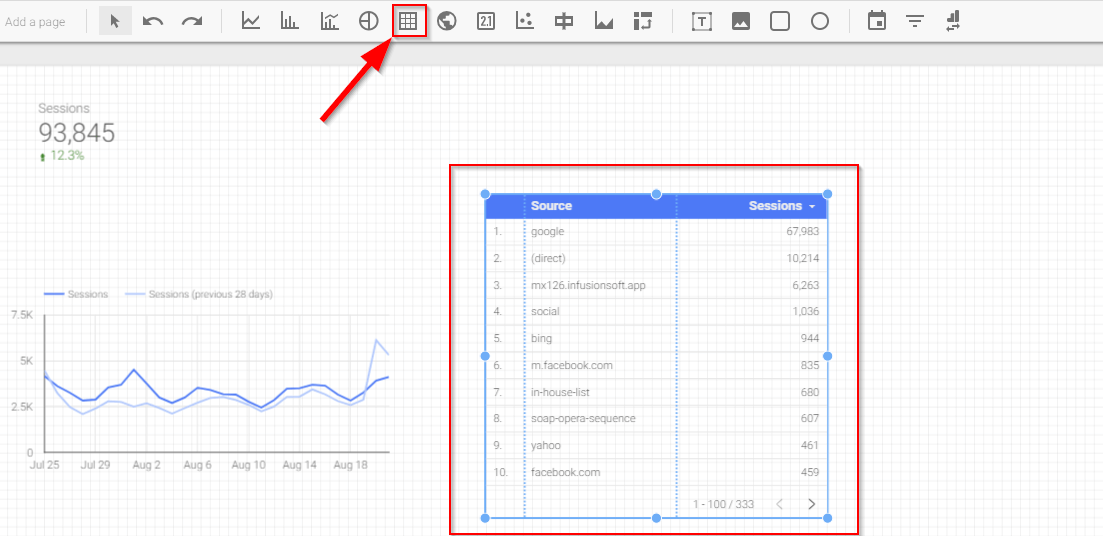
3.3. Tables
- Top landing pages with sessions, bounce rate, and avg. time on page
- Top search queries with clicks, impressions, and click through rate
How to Make a Table
Similarly to the others, all you need to do to create a table is:
- Click the table icon on the toolbar
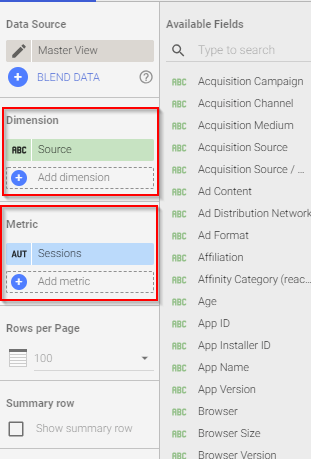
- Click and drag in the dashboard area
- Select your dimension (the main column in your table)
- Select your metrics (the stats you use to interpret the performance of the dimension)
- Add a previous period date comparison
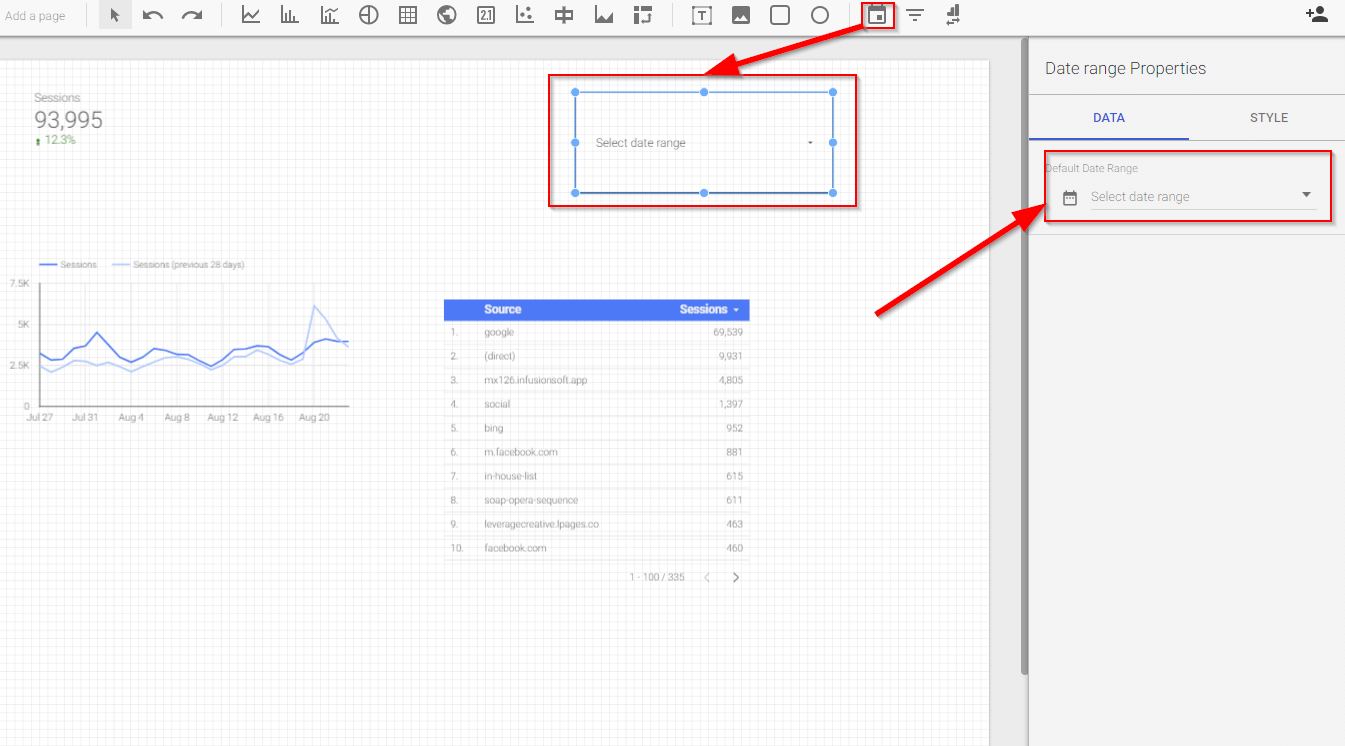
3.4. A date slicer
It'll help users change the date periods of the data.
How to Add a Date Slicer
- Click the date range icon
- Click and drag in the dashboard area
- Select your default date range (I normally go with the last 30 days)
4. Make It Fancy
You may have noticed from my screenshots that my dashboard looks pretty rough. Luckily, we can fix that. :) All we need to do is organize the elements we added in 3 paragraph.
How you design and organize your dashboard is ultimately up to you, but here's what I recommend:
- Add your logo in the top left corner
- Move your date slicer in the top right corner
- Move all scorecards in between your logo and date slicer (along the top)
- Add a line underneath the top section with your logo, scorecards, and date slicer
- Move line charts underneath that line (a new section)
- Move tables underneath the line charts (a new section)
- Add titles to all charts
I don't expect you to see exactly what I'm describing through my words, so here's an example:
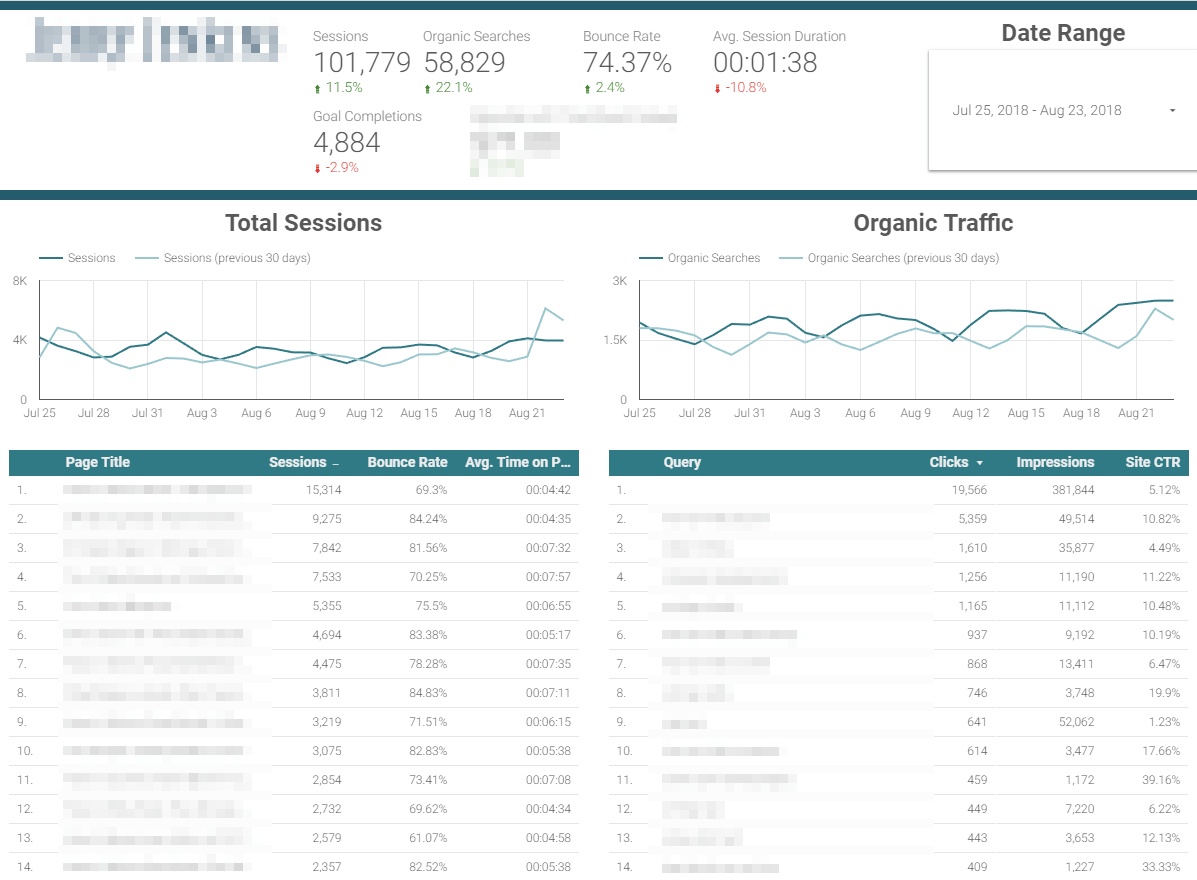
It doesn't really matter how fancy your dashboard is as long as it's easily understandable and at leastlooks pretty good.
5. Share Your Dashboard
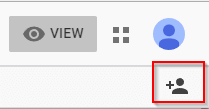
Congrats! You've finished your SEO dashboard. It's time to share it. Simply click the share button in the top right corner of the page and enter the emails of individuals who can't wait to see your dashboard (similarly to how it works in Google Docs / Sheets).
One thing to note: data gets updated from Google Analytics and Google Search Console automatically. All you have to do is set up the dashboard and share it once with your team.
Google Data Studio: The Best of Both Worlds
Data Studio lets you combine data from Google Analytics and Google Search Console to make the ultimate SEO dashboard for your business. First of all, you should set your KPI's and then arrange them in your dashboard. Such elements as line charts, scorecards, tables and date slicer can help you ease your work.
No more spending tons of time making Google Analytics SEO dashboards that just collect dust after a few weeks. :)
And how do you create your SEO reports? Share your hacks in comments below.